Vegetation encroachment detection along power lines
Vegetation encroachment detection finds vegetation growing into the clearance zone of a power line before it causes a flashover or an outage. GridGuardian screens every span with satellite height bands and growth trends, measures the exact clearance with LiDAR only where the screening flags a span, and sends the confirmed grow-ins to crews in FieldGuard.
Why monitor encroachment span by span?
Vegetation is the most common cause of power outages in the U.S., at more than twenty percent of incidents.[1] For transmission lines under NERC FAC-003-5, owners must manage vegetation to prevent encroachment into the Minimum Vegetation Clearance Distance (MVCD) and inspect 100% of applicable lines at least once per calendar year, with no more than 18 months between inspections.[2]
The DOE guide cites a utility comparison that found LiDAR the most accurate method for locating clearance violations, but roughly two to three times more expensive than a traditional patrol.[1] That is the trade-off this page is about: precise data costs money, so it should go where the risk is.
Screen everything, measure precisely where it closes in
The open satellite gives a cheap, continuous look at every span; LiDAR and crews go to the spans that need an exact answer.
- Satellite · base resolution
Watch the buffer zone on every pass
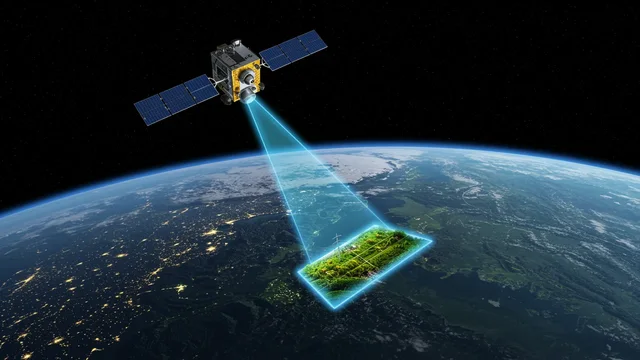
Sentinel-2 revisits every 5 days at the equator.[3] Cloudy passes are discarded. On each usable pass, our own neural network sets the height band, vigour and growth trend inside the buffer zone, and change monitoring compares the span with its own history. The buffer is adjustable per voltage level or section.
Height bands, not the distance to the conductor. Clouds can delay the next usable pass.
- LiDAR
Measure the clearance where flagged
On flagged spans, a classified LiDAR point cloud gives the conductor-to-vegetation distance in 3D. You can fly it, have it flown, or upload your own survey to the self-service analysis.
LiDAR measures the conductor where it hung on the day of the flight. Sag changes with temperature and load, so engineering margins still apply.
- High-resolution satellite
When no flight is possible
0.3–0.5 m stereo imagery from the data marketplace gives single trees and their heights over the flagged sections, without a flight permit.
- Drone or vehicle
Confirm on the ground level
A drone confirms single spans. For distribution lines along roads, the vehicle camera records roadside vegetation, with height where the geometry allows it.
The vehicle sees only what the road sees.
- GridGuardian → FieldGuard
Risk class, work package, crew
Exposure times hazard gives each span HC0–HC3; the measured growth trend shows which spans are closing in fastest. Work packages go to crews in FieldGuard, who trim offline and record before and after photos.
- Satellite · next pass
Verify and track regrowth
The next usable pass shows whether the buffer zone came back to HC0, and how fast the span greens up again, so the next cut is planned from measurement.
What each signal tells you about encroachment
| Signal | Data source | What it tells you | Limit |
|---|---|---|---|
| Height band and growth trend | Sentinel-2 + own neural network | Which spans are closing in on the buffer zone | Bands, not metres; 10 m pixels; cloud |
| Change against the span's history | Sentinel-2 | New growth, clearing, drying | Needs a cloud-free pass |
| 3D clearance | LiDAR | Exact conductor-to-vegetation distance | Cost per km; snapshot at flight-time sag |
| Tree height from stereo | High-resolution satellite | Single trees in flagged sections | Bought per area; needs a clear day |
| Roadside vegetation | Vehicle camera | Distribution lines along roads | Only what the road sees |
| Crew observation | FieldGuard | Confirmation and evidence | Only on visited spans |
More on choosing between carriers: satellite vs LiDAR vs drone.
Which platform links encroachment detection to crew work orders and proof of completion?
With us you find all of it in one place. The grow-in detection, the risk class, the work package and the crew's evidence are tied to the same span in GridGuardian. FieldGuard works offline, records photos with location and time, and closes each package with a completion check.
Results export to SAP PM, Power BI, file or API, and the next satellite pass checks the result.
- Detection and risk class (HC0–HC3) on the span and its poles, with your own identifiers
- Work package to the crew or contractor in FieldGuard
- Offline in the field; photos with location and time; signature
- Completion check in the office, then the next satellite pass
- Exports to SAP PM, Power BI, file or API
Encroachment questions
What is vegetation encroachment on a power line?
Encroachment is vegetation growing into the clearance zone around a conductor. If it gets close enough, current can flash over to the vegetation, which can cause an outage or a fire. Detecting it early means trimming before the clearance is lost.
What is MVCD?
MVCD, the Minimum Vegetation Clearance Distance, is the clearance that NERC FAC-003-5 requires transmission owners in its scope to keep vegetation out of. Distribution lines follow national, state or company rules instead.
Can a satellite detect clearance violations?
Not to the metre. Sentinel-2, through our own neural network, gives height bands, vigour and growth trend on every span, which is enough to flag the spans that are closing in. Whether the clearance is actually violated is measured with LiDAR or confirmed in the field.
How often is encroachment checked?
The satellite data is refreshed continuously and cloud-covered passes are discarded. The packages refresh the risk picture quarterly, monthly or weekly.
Do we need LiDAR on every span?
No. LiDAR is ordered for the spans the satellite flags, and a LiDAR stretch also calibrates the satellite model to your terrain and species.
What does encroachment monitoring cost?
Satellite screening is $9 per mile or €5 per km per year with quarterly refresh, up to $22 per mile or €12 per km weekly. LiDAR processing is $90 per mile or €50 per km. High-resolution imagery is at market price, only where needed. The full list is on the pricing page.
Try it on your own network
Send about 100 km of corridor and its network geometry. The base system is set up on it at no cost, and you can check the results in the field with FieldGuard.
- U.S. Department of Energy, Grid Deployment Office (prepared by Lawrence Berkeley National Laboratory): Vegetation Management. Resilience Investment Guide, September 2024. https://www.energy.gov/sites/default/files/2024-11/111524_Vegetation_Management.pdf
- NERC Reliability Standard FAC-003-5, Transmission Vegetation Management. https://www.nerc.com/pa/Stand/Reliability%20Standards/FAC-003-5.pdf
- ESA / Copernicus SentiWiki: Sentinel-2 mission overview (revisit and spatial resolution). https://sentiwiki.copernicus.eu/web/s2-mission