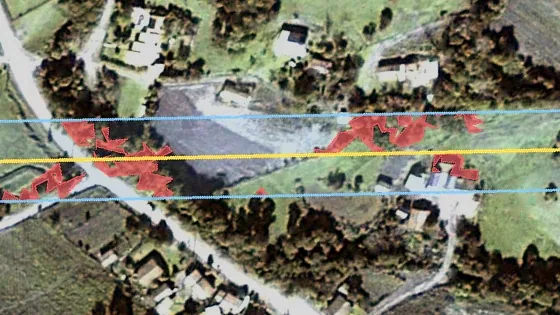
Line axis
20 m clearance zone
Tree crowns inside
01
Trees in the clearance zone
Every crown inside the zone you set, per span, with its height band.
Satellite imagery, read along your lines
We turn 30–50 cm satellite imagery into answers along your lines – and you can browse what exists for your corridor in our public marketplace.


Every crown inside the zone you set, per span, with its height band.

Structures inside the right-of-way, with their distance to the line axis, and new construction since the last image.
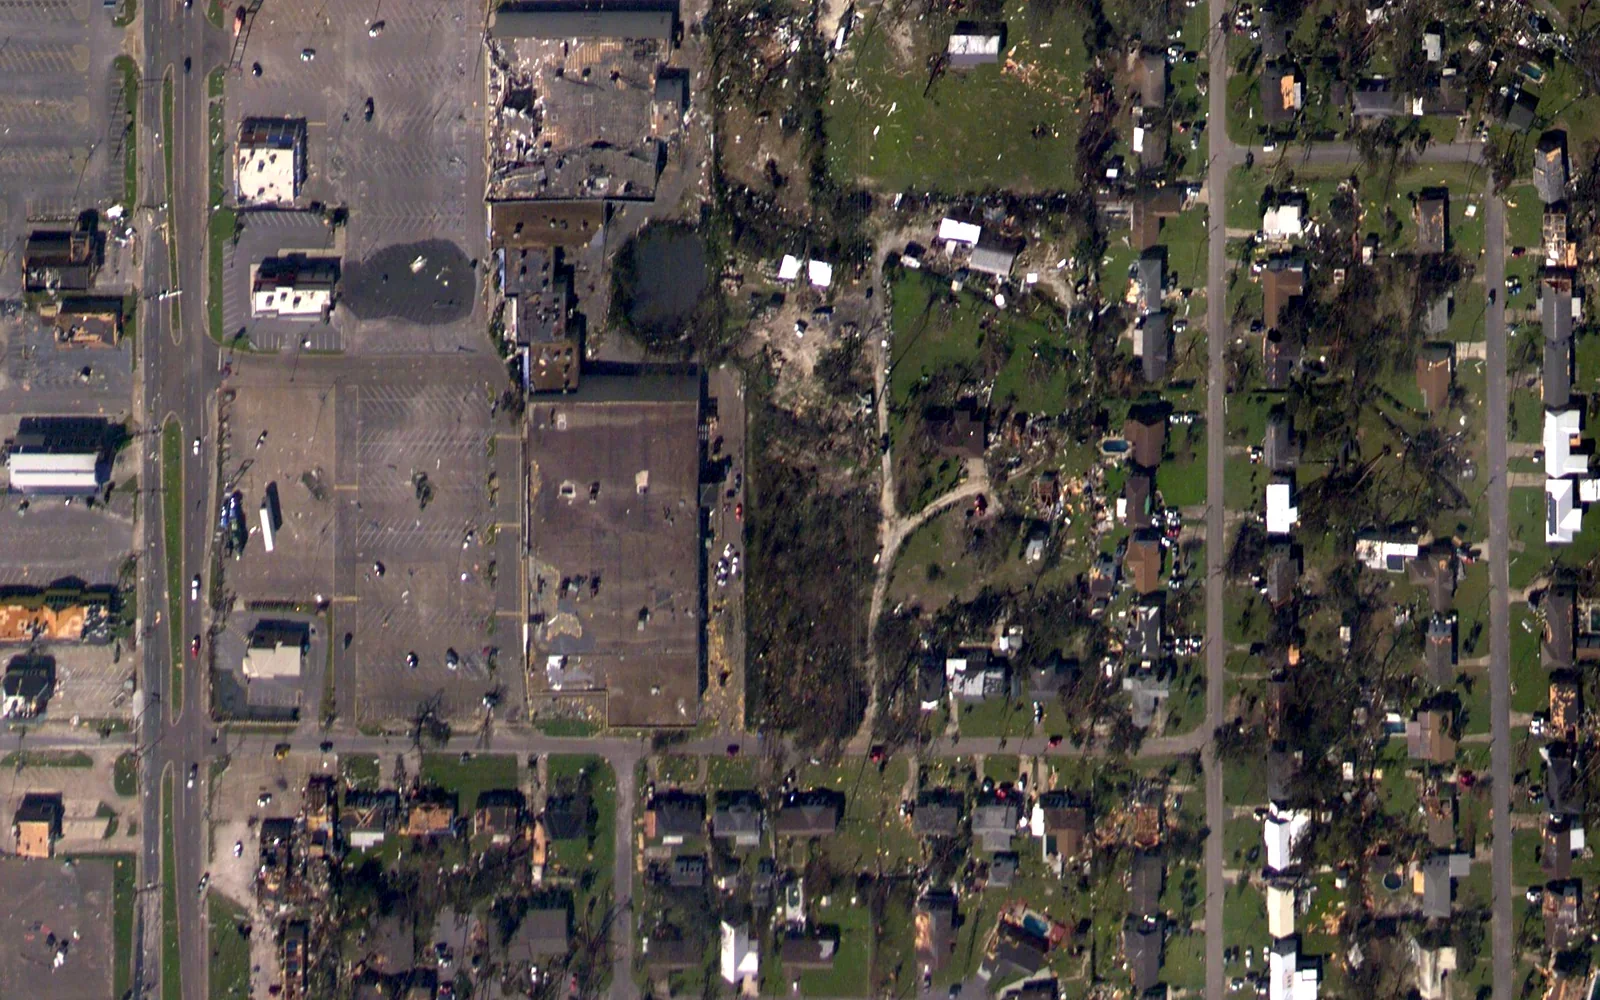
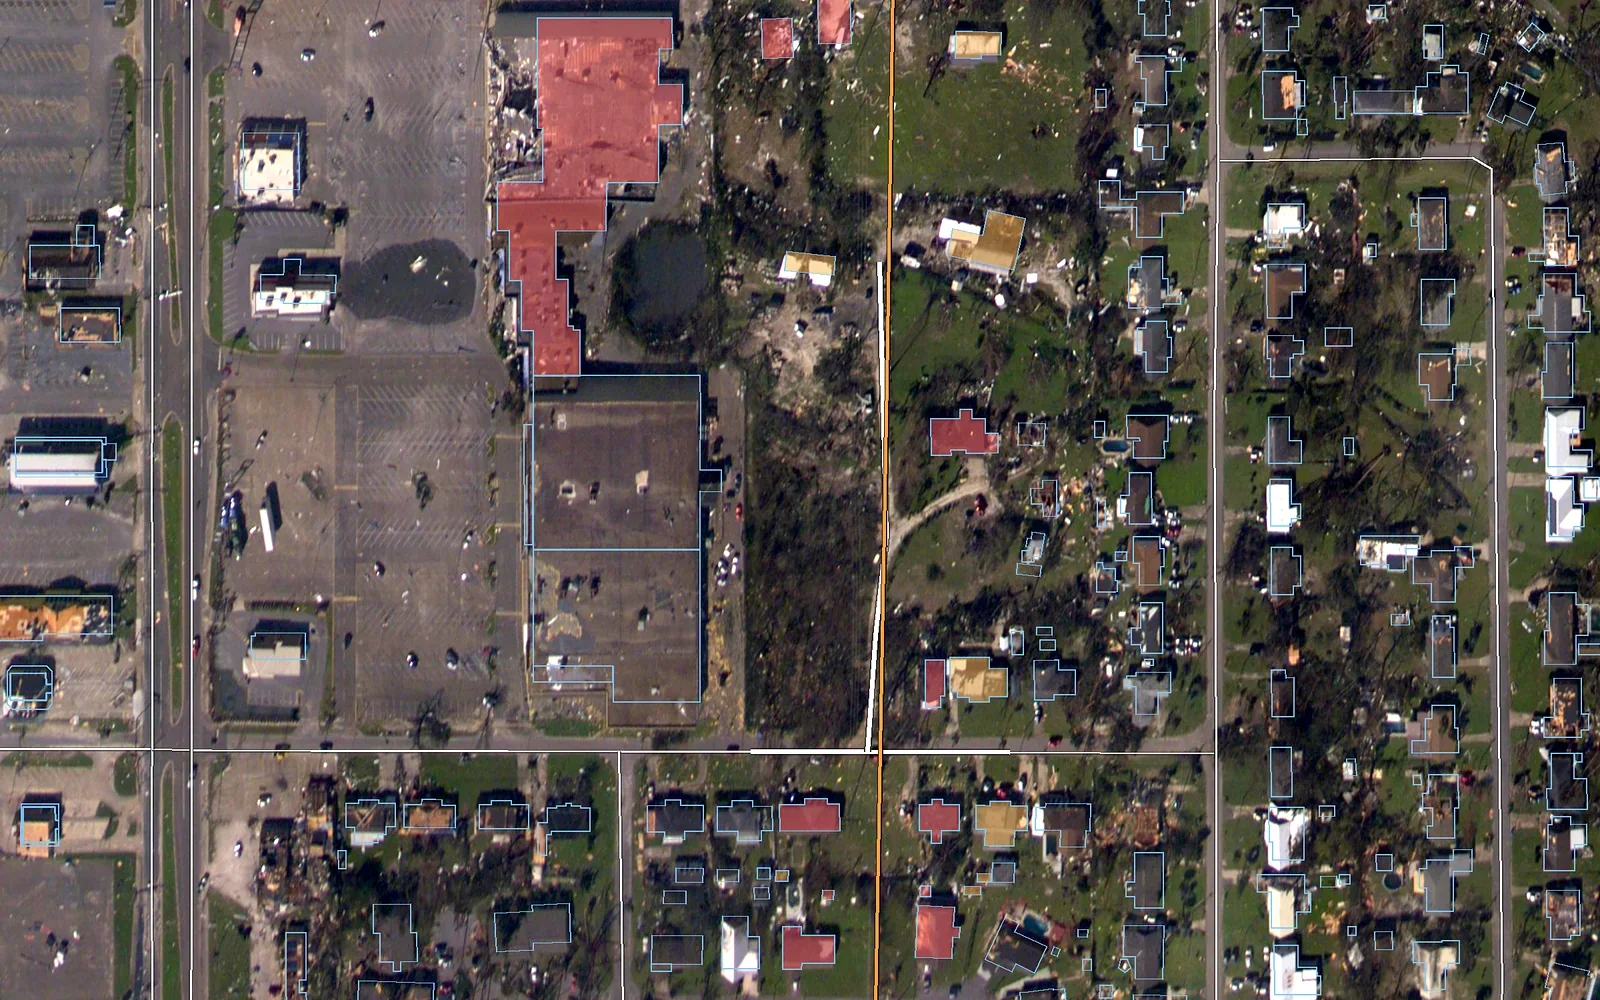
After a storm, every building and road near the line is sorted by its distance from it, on the first clear image of the area. Crews see which streets to clear and which properties to check first, without waiting for site access.
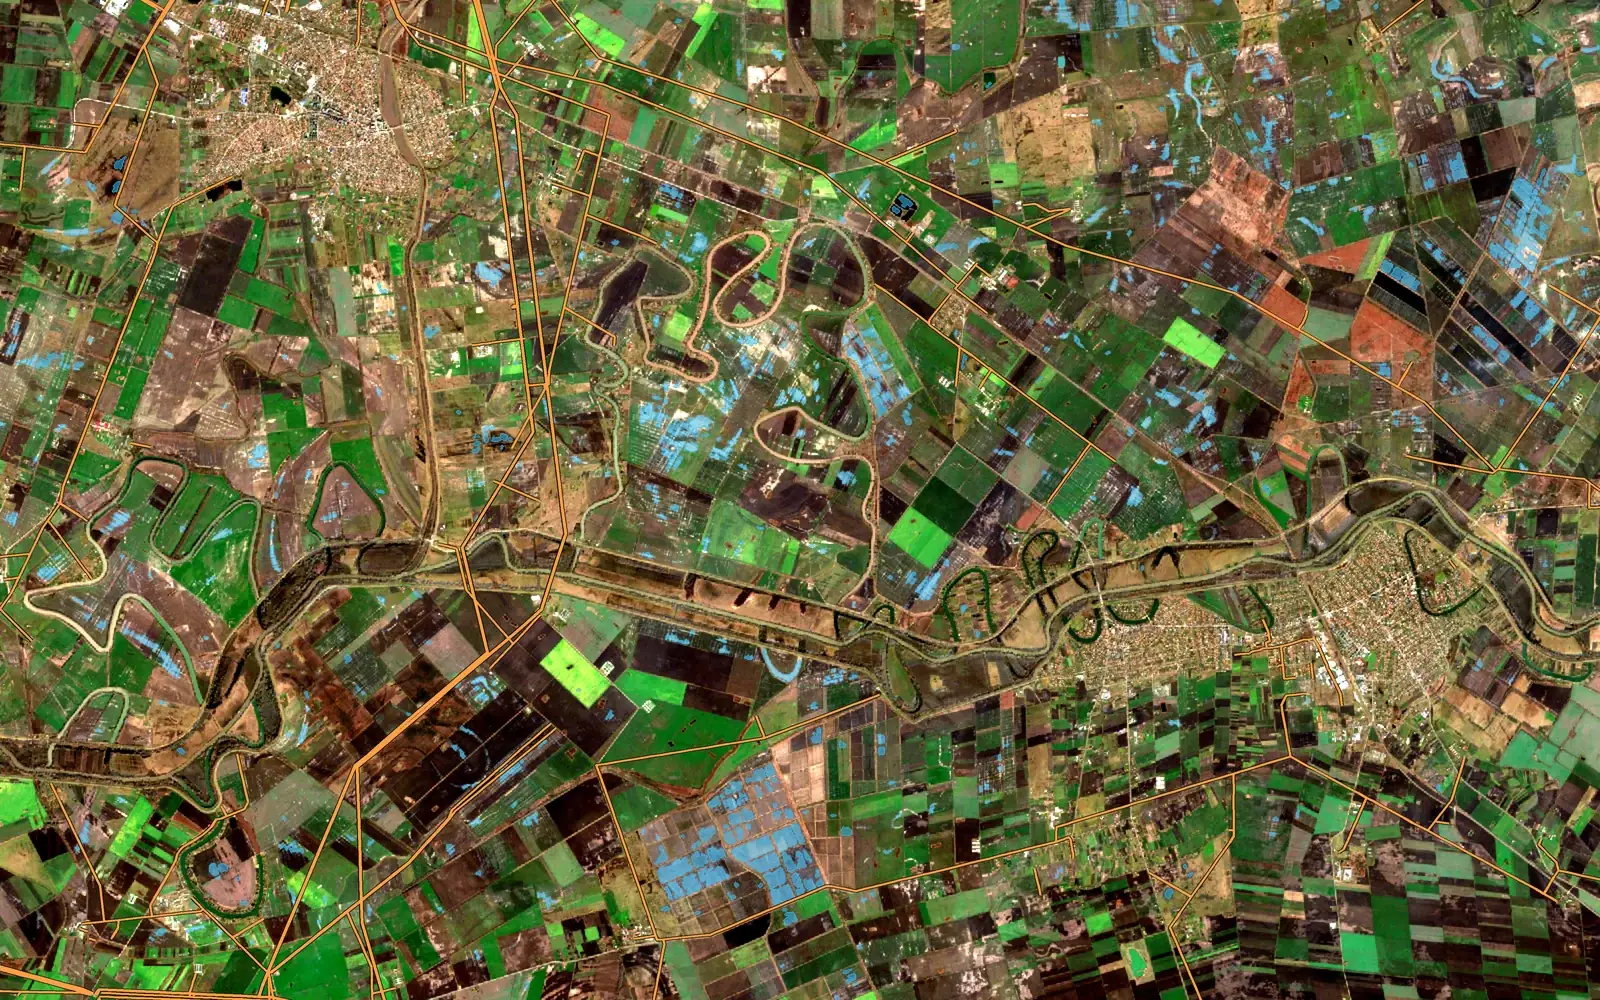
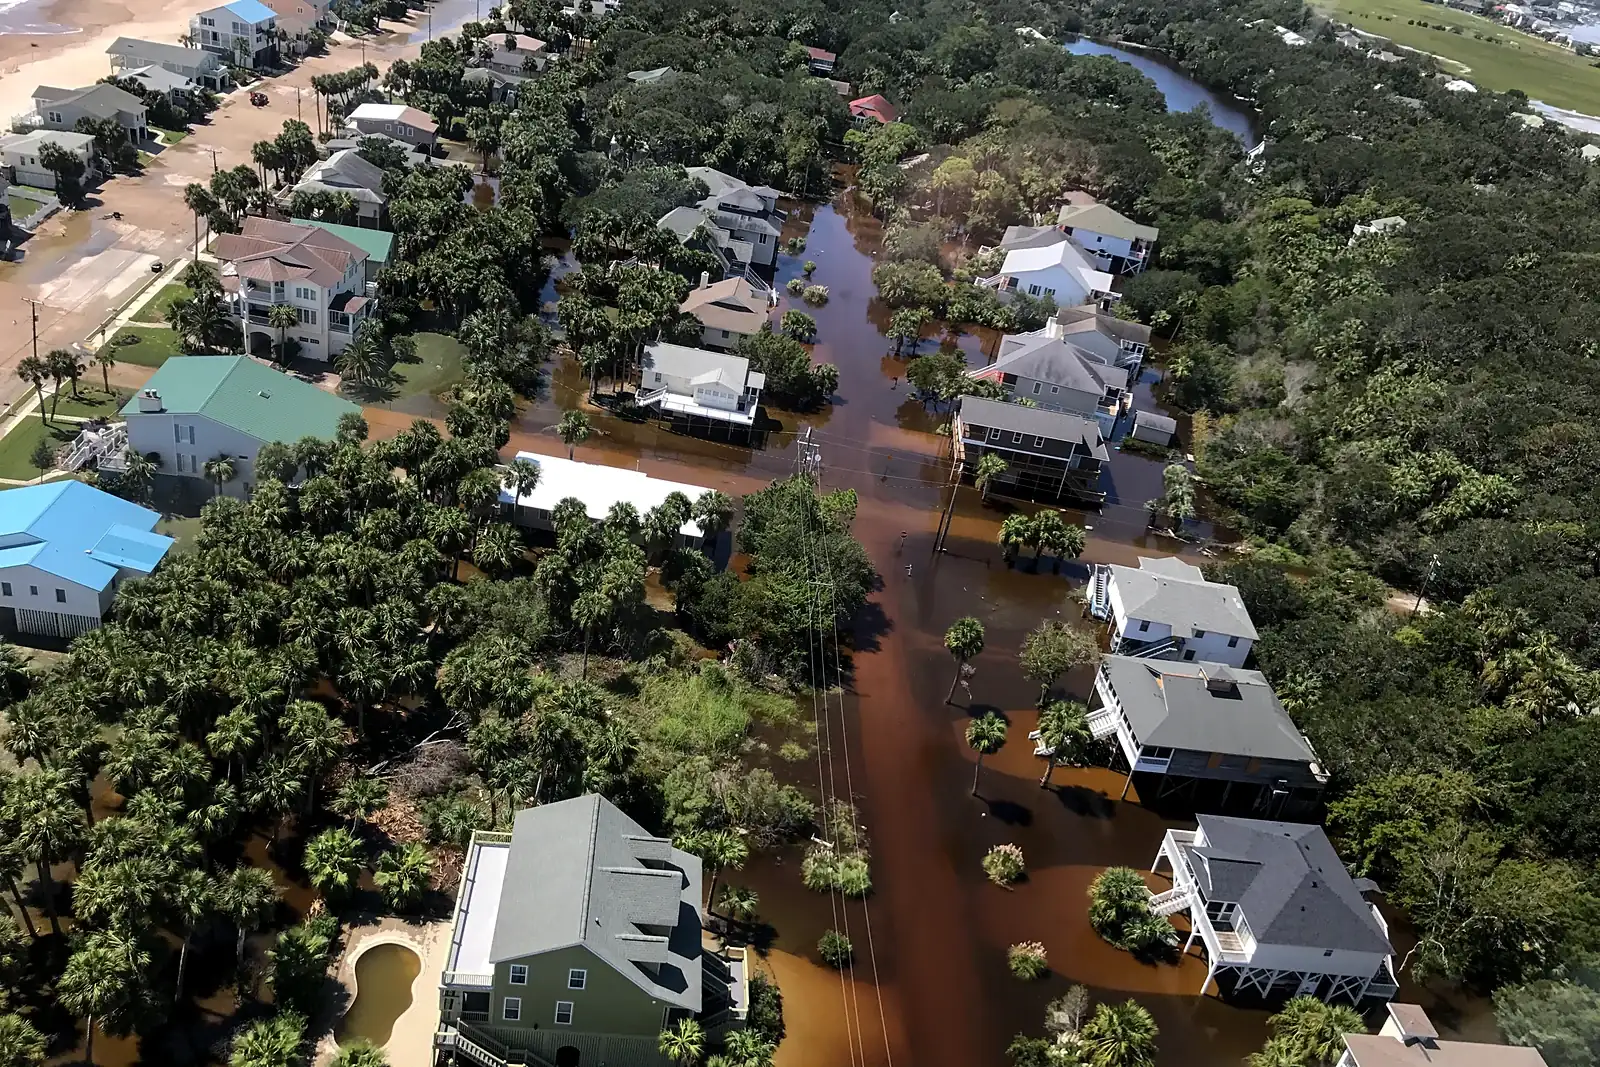
Standing water around poles and access routes after snowmelt or heavy rain, mapped from optical imagery on clear days and with radar when it stays cloudy.
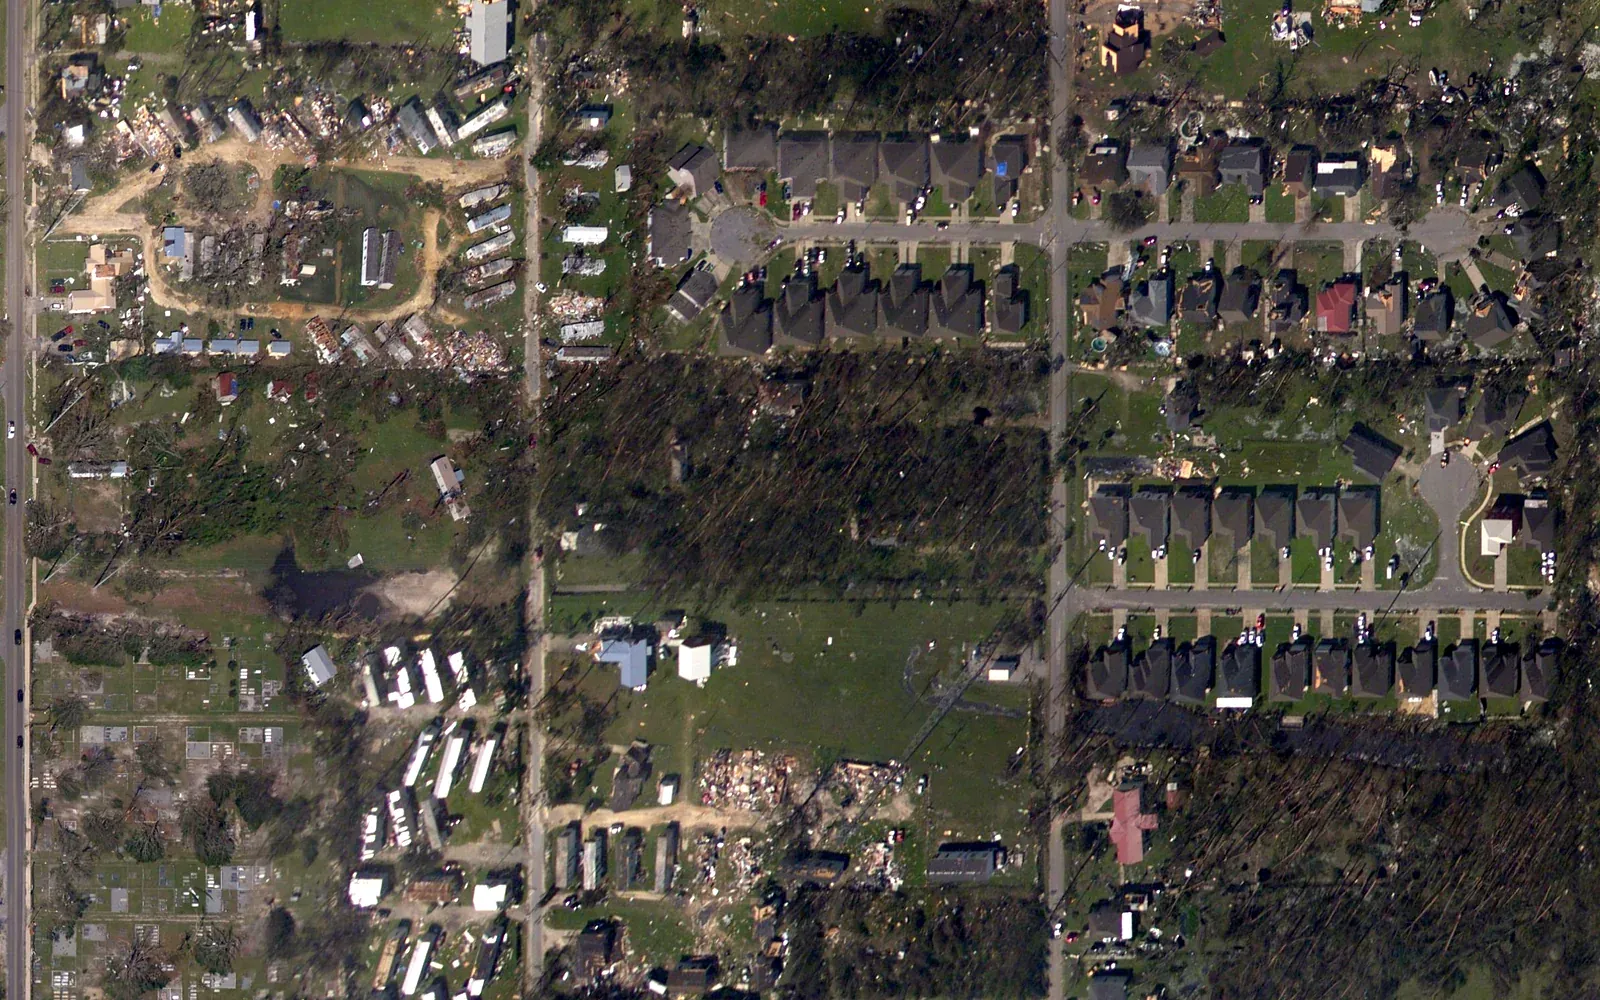
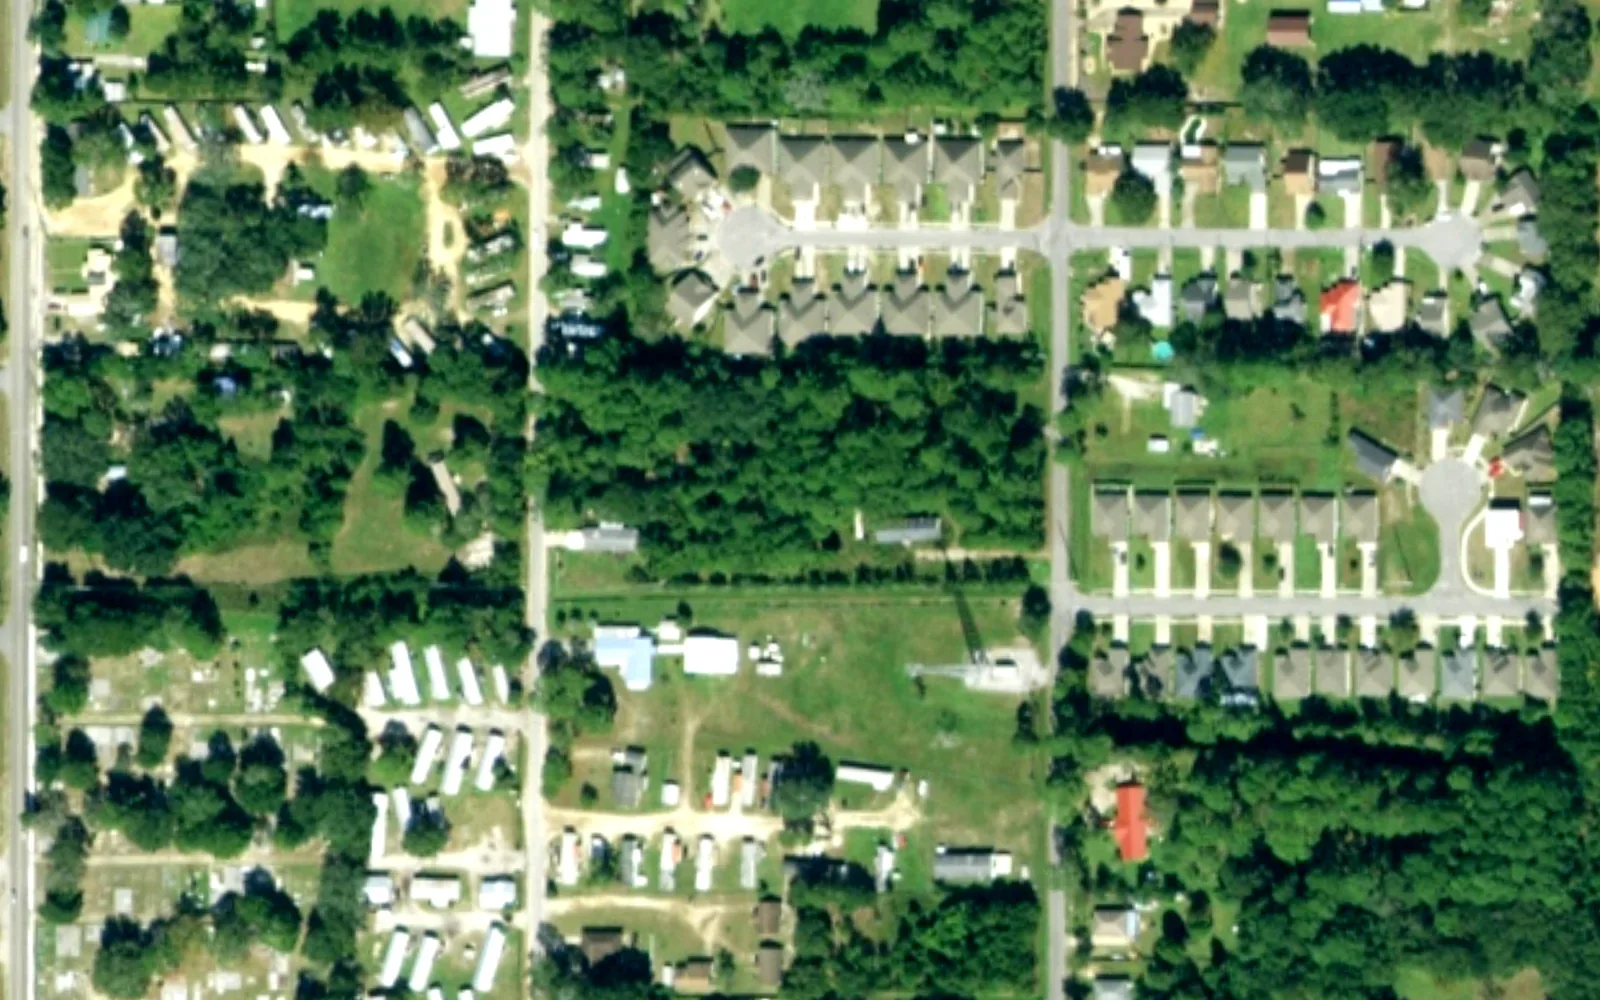
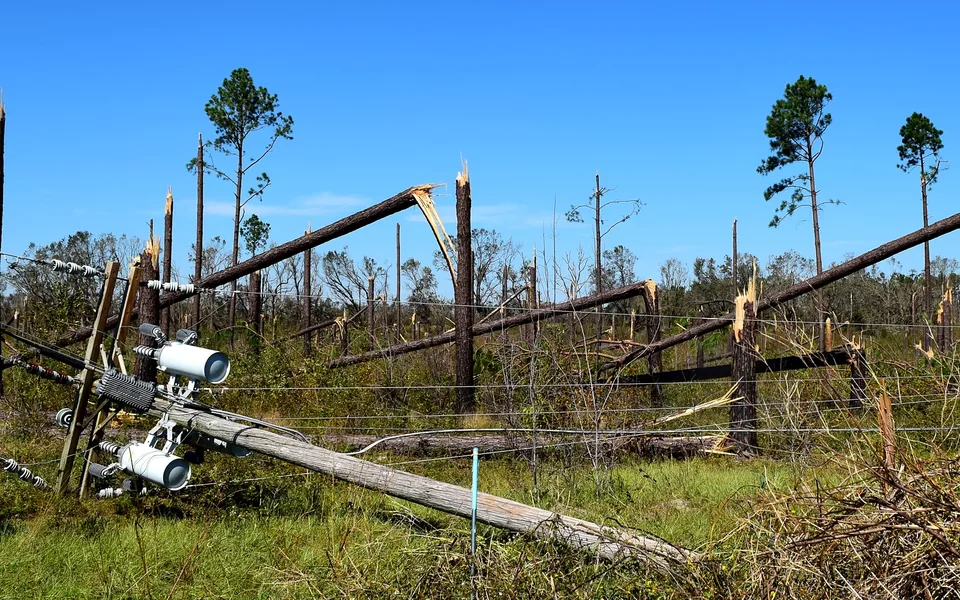
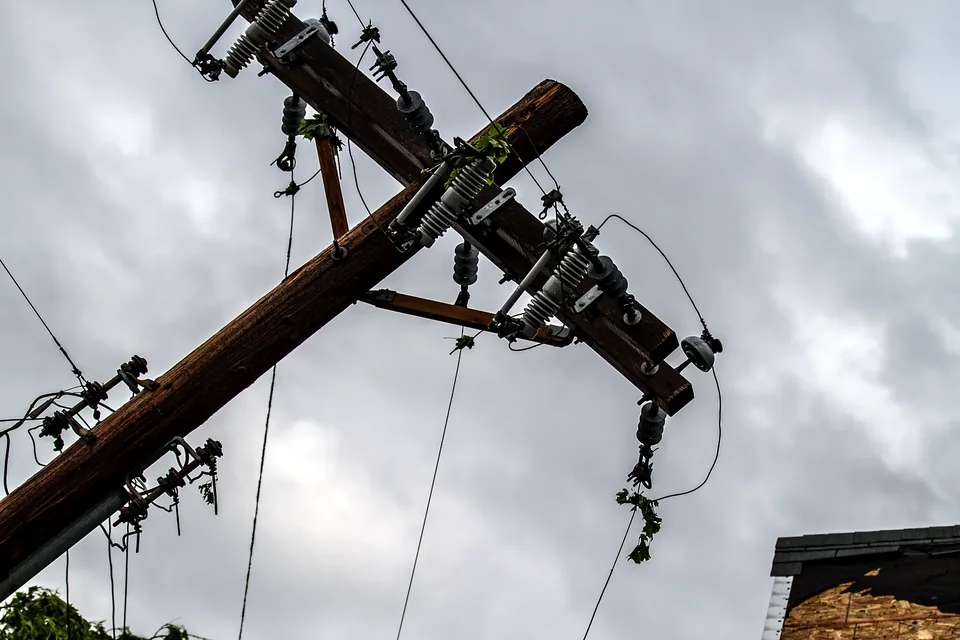
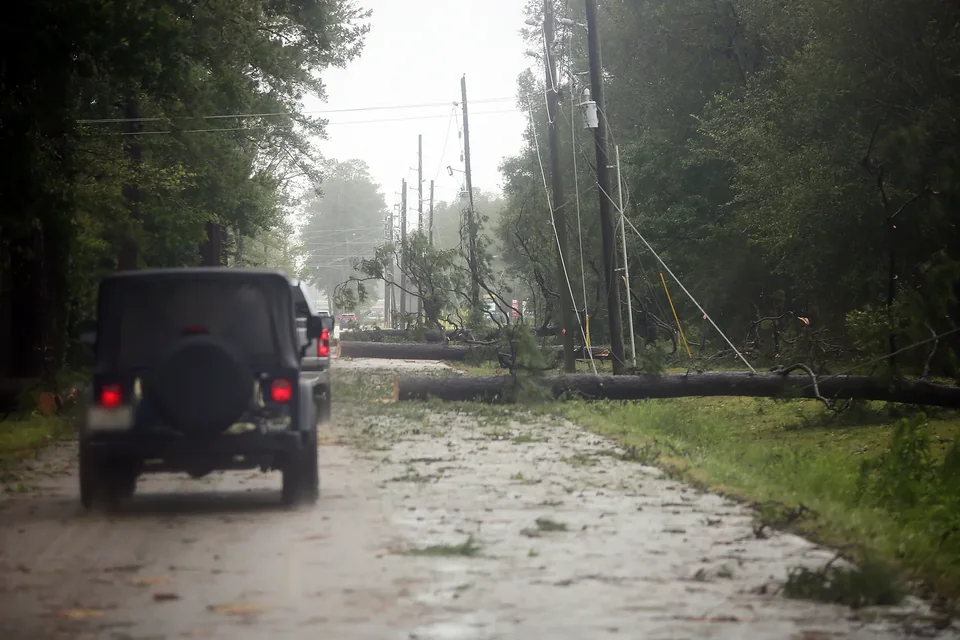
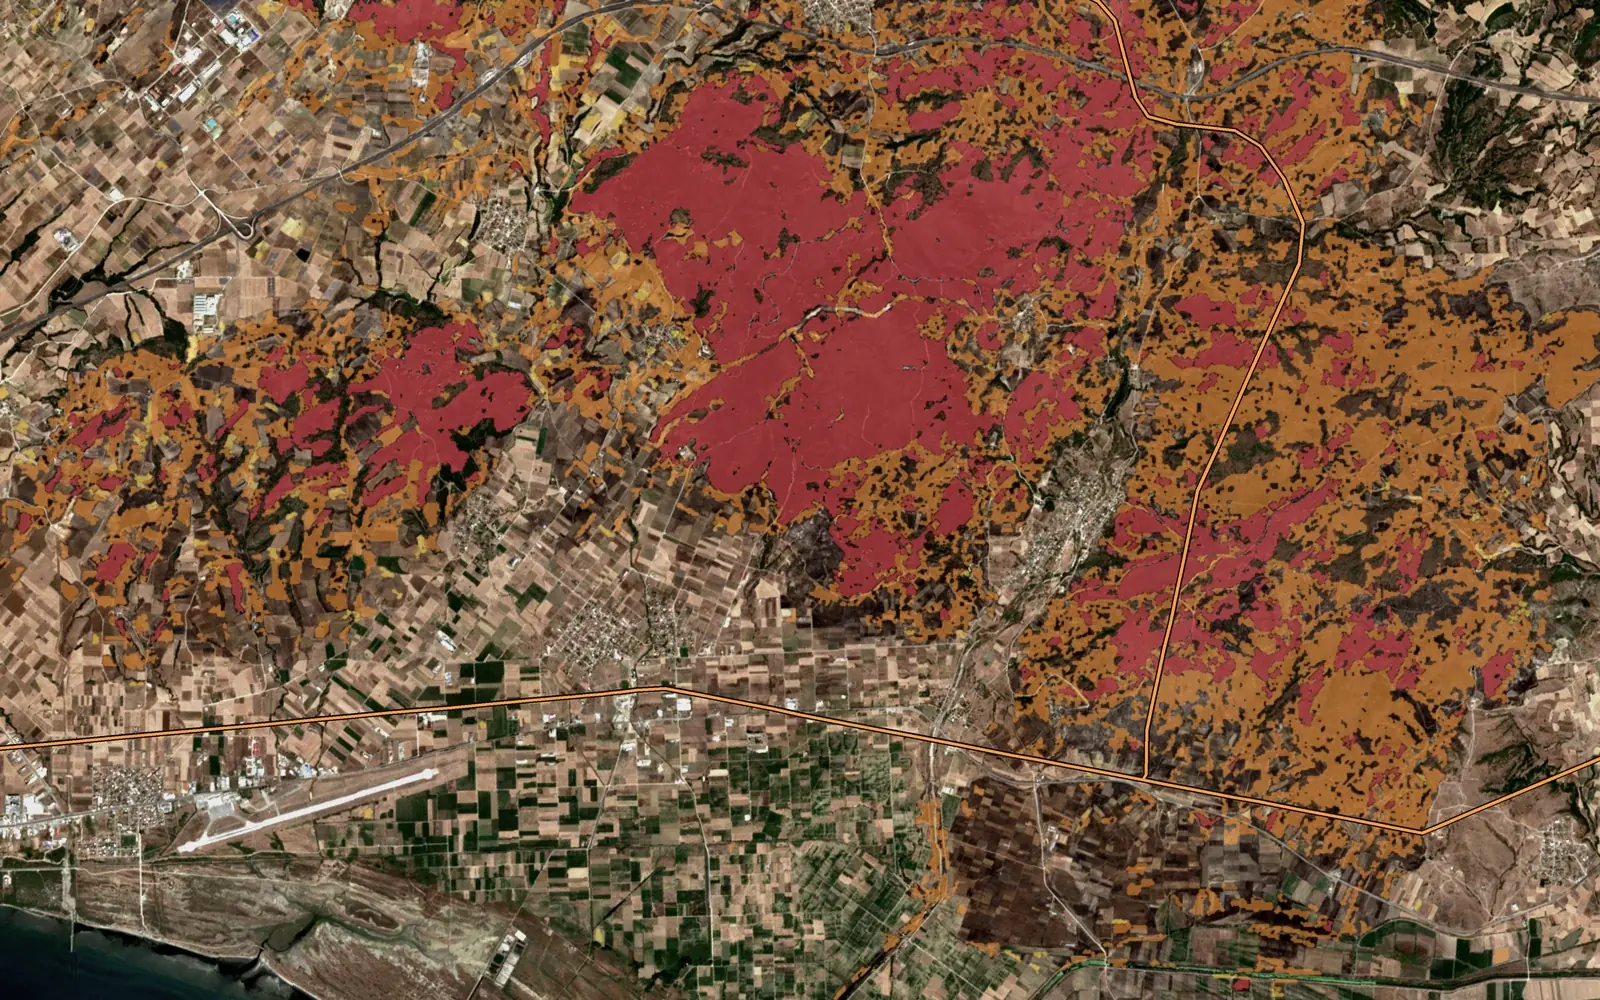
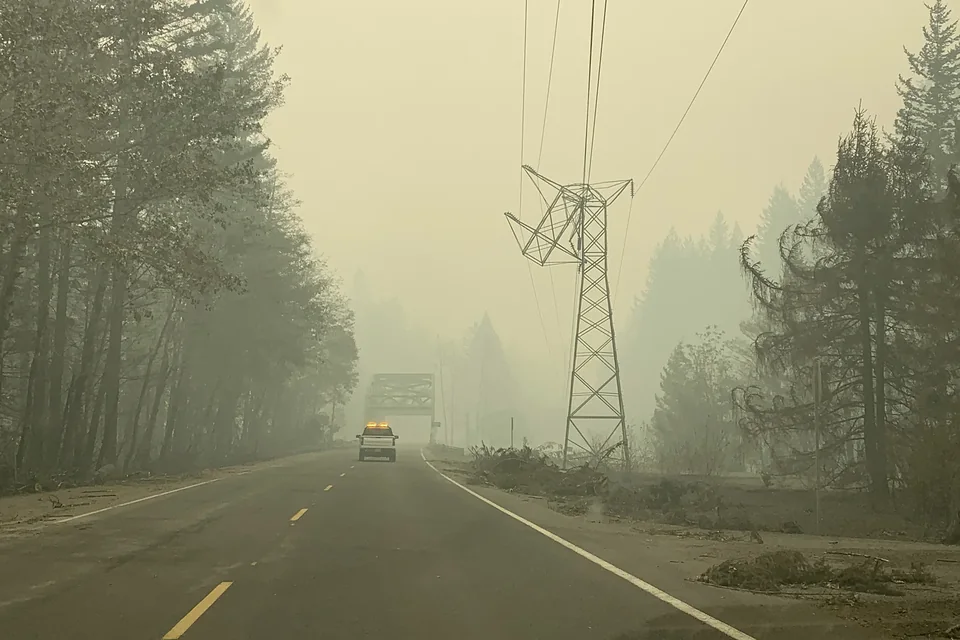
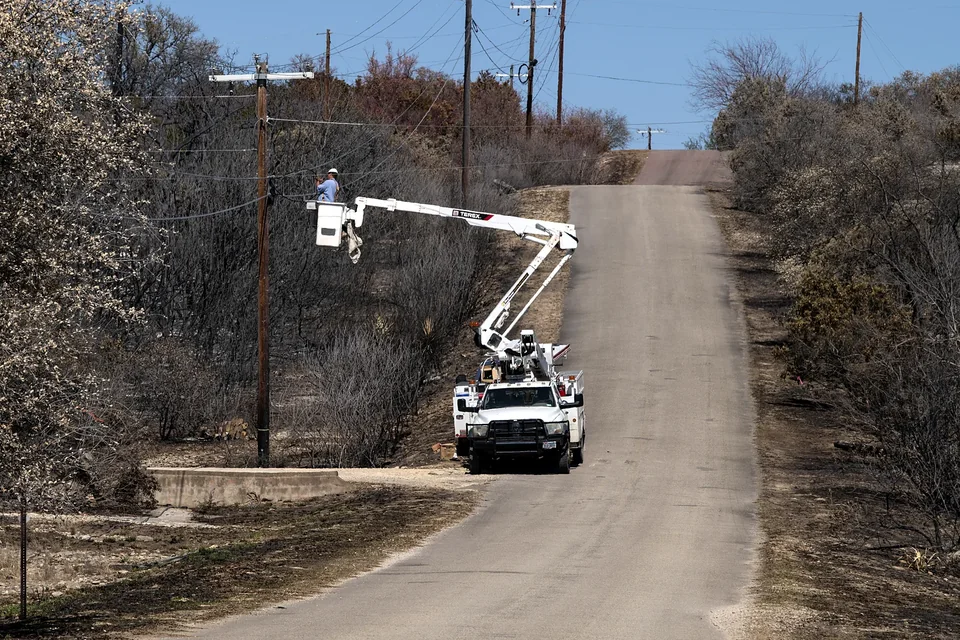
Fallen trees across the line, blocked access, burned ground, mapped corridor-wide in one pass.
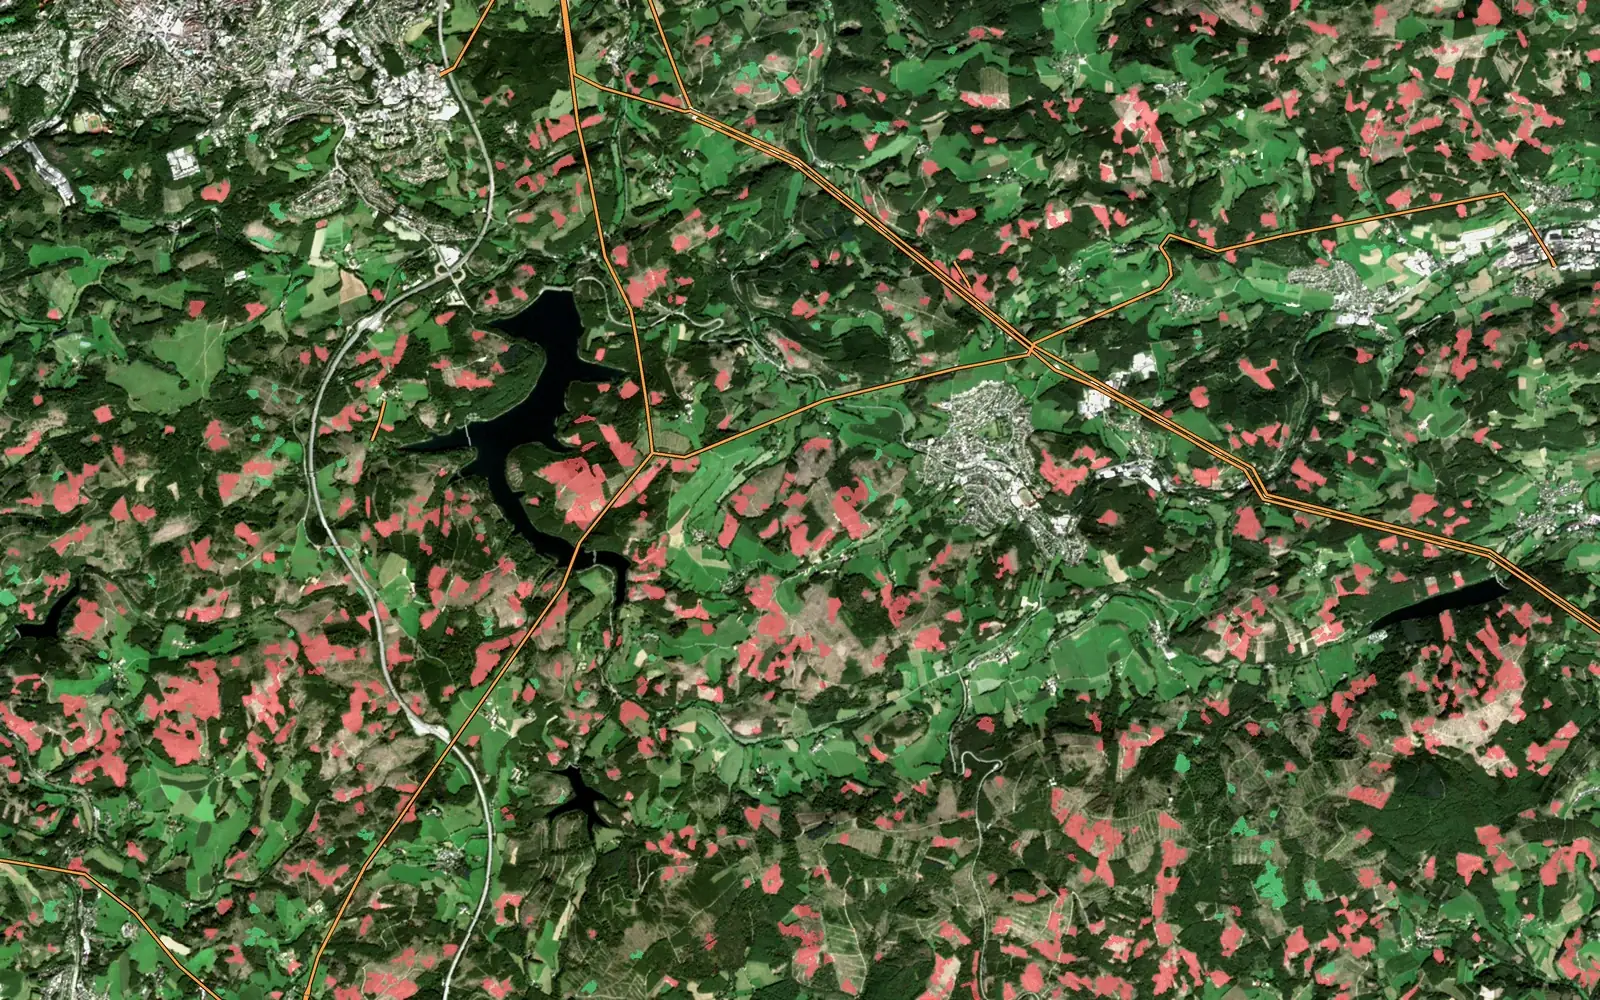
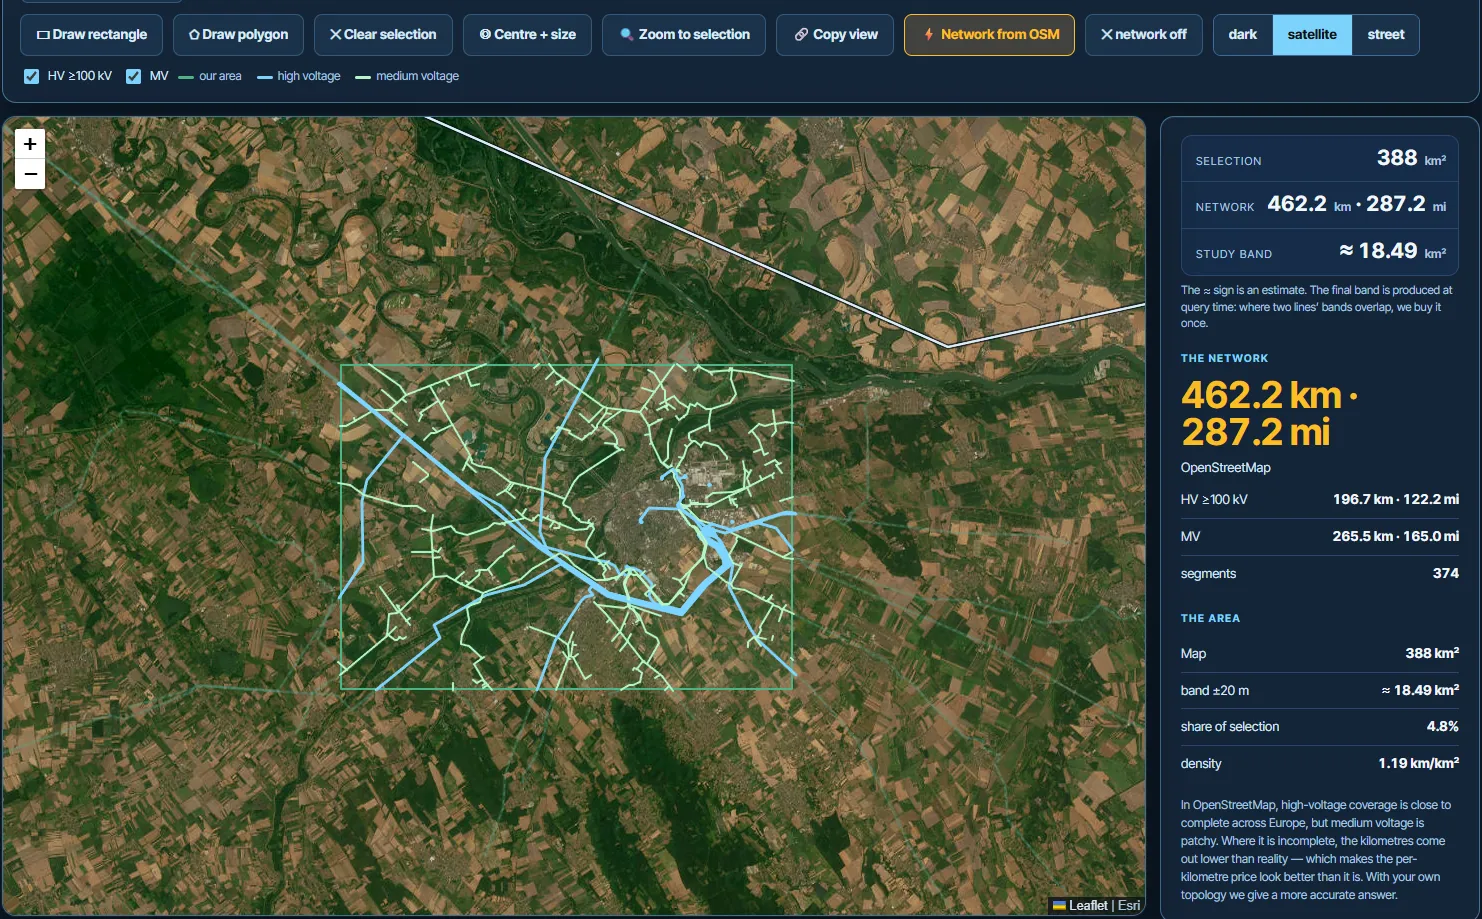
Most imagery shops sell scenes by the square kilometre. Ours starts from your line.
Built for power lines; pipelines and rail corridors work the same way.
The technology is the same in every industry: high-resolution imagery, change detection and object recognition. What changes is the question you ask of it.
Trees growing toward lines, encroachment in the corridor, access tracks, storm damage along hundreds of kilometres, verification that clearing work was done.
Typical resultTree height bands per span, encroachment lists, work lists for your maintenance system.
Vegetation management →Crown counts, gaps and windthrow, illegal felling, tree height from stereo, forest edge change.
Typical resultTree inventory and change maps as GIS layers.
Hazard tree detection →Field boundaries, crop damage after hail or flood, drainage problems, orchard and vineyard tree counts.
Typical resultDamage maps and object counts per field or block.
AgriGuard →Before-and-after views of a storm, flood or fire, for many properties at once, without waiting for site access.
Typical resultBefore-and-after damage maps and a report per area.
Progress monitoring, stockpiles and earthworks, site boundaries, haul roads.
Typical resultChange maps between capture dates, as GIS layers.
New buildings, tree canopy cover in streets, green space, land use change.
Typical resultCanopy and new-building layers, change maps.
Which roads are blocked, which areas are flooded or burned, where to send crews first.
Typical resultDamage and access maps for planning the response.
Storm damage assessment →Not on the list? It is probably still doable: the satellite data and processing are the same, the only difference is what we look for in it.
Describe what you need →Ranked, with the evidence for each finding.
GeoJSON, Shapefile, KML, ready for your GIS.
A short PDF with the findings and the maps.
Work orders straight into your maintenance system.
Single tree crowns, buildings, vehicles, roads, fallen trees and storm damage. Wires and small hardware such as insulators are not visible; for those you need drone or close-range imagery.
Yes, from a stereo pair: two images of the same area taken from different angles. We report height in bands, which matches the real precision of the method.
No. We deliver the analysis; the marketplace shows what exists for your corridor.
It depends mostly on clouds, the shape of the area and the viewing angle. Archive images are the fastest; a new acquisition in a cloudy season may need several attempts.
Satellite for wide areas and repeat checks, LiDAR for exact clearance distances, drone for close-up condition of poles and hardware.