We build our own vehicle camera system: cameras on the car, a computer in the car, detection running live at 15 frames per second while you drive. One pass produces a pole inventory, the assets on each pole, and the vegetation along the corridor — as data, not as hours of video nobody will watch.
Starts only when you ask: it uses the graphics card.
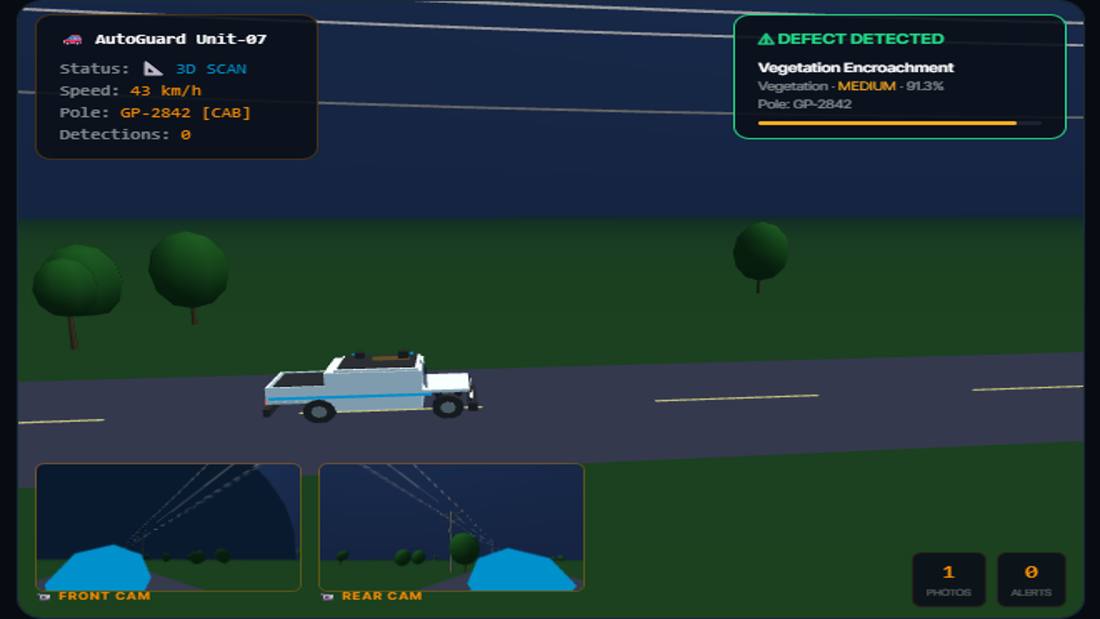
Illustration of one vehicle pass: corridor scan, front and rear camera, detections as they come in.
Detection in the car, not in a data centre
The cameras run at 15 fps and the detector runs on board, so what leaves the vehicle is the finding, not the footage. A day's survey is megabytes, not petabytes.
Two cameras, both sides in one pass
A single forward camera means driving every street twice. Two cameras cover both sides in one pass and roughly halve the driving time.
40+ km of line per day
At normal traffic speed, with the route planned so no street is driven twice for nothing.
The system on the car
What comes out of one pass
Poles located from the footage and put on the map, each one with the frames it was seen on
Assets on the pole: insulators, cross arms, and what is missing
Vegetation along the corridor, with height where the geometry allows it
A street-by-street work list, and a map of what is still to survey
€1 / $1.1 per pole, per year
We analyse poles, so we charge for poles: a yearly fee per pole, not per square kilometre, not per image, not per hour of processing. Your cost is known before the first drive and does not move.
Before you buy the system, try the analysis on your own footage.
Here is our proposal. Look at the city drives on this site first — and notice what they were recorded with: an ordinary action camera on a windscreen, the kind anyone can buy for a few hundred dollars. Nothing else. Send us a few streets of your own and we will run the same analysis on them, free of charge. It is a test, not a survey: it shows you what comes out, on your own network, before you decide anything.
1 · DRIVECamera on the windscreen, drive the line at normal speed, GPS on. A few streets are enough to see what comes out.
2 · SENDUpload the file. You confirm you hold the rights to it; we treat it as confidential and never republish it.
3 · GET THE ANALYSISAn interactive map and report like the city drives on this site, plus the underlying data — derived products, not your imagery.
First run free, one area per organisation, up to 30 minutes of footage. Get in touch and we will send the upload details.
Two ways in
Be clear about which one you are looking at, because it decides what to expect. One is a test you can run yourself this week; the other is the survey you buy.
Test itany action camera · a few hundred dollars
See the analysis on your own streets
Vegetation along the corridor, assets on the poles
Most of the cost of a camera survey is not the camera. It is the video you keep and the cloud you rent to look at it afterwards. Our system removes both.
What you pay for
€1$1.1per pole per year
Poles, not pixels
We analyse poles, so we charge for poles. Not per square kilometre, not per image, not per hour of processing. The number is known before the first drive.
Drive it as often as you like
Once the camera is on your vehicle we do not count passes. After a storm, twice a season, every month — the annual fee per pole does not move.
Counted on the server, not on trust
Every analysed pole lands on the server. Both sides see the same number of poles covered, so there is nothing to argue about at invoicing time.
Europe
North America
Per pole, full survey, per year
€1
$1.1
Average span assumed
40 m
150 ft (≈ 46 m)
Poles per unit of line
25 per km
35.2 per mile
Per line length, per year
€25 / km
$38.7 / mile
We bill per pole. Line-length prices are averages at the spans shown; denser lines cost more per km, sparser lines less. Invoicing in EUR or USD. Unlimited passes included.
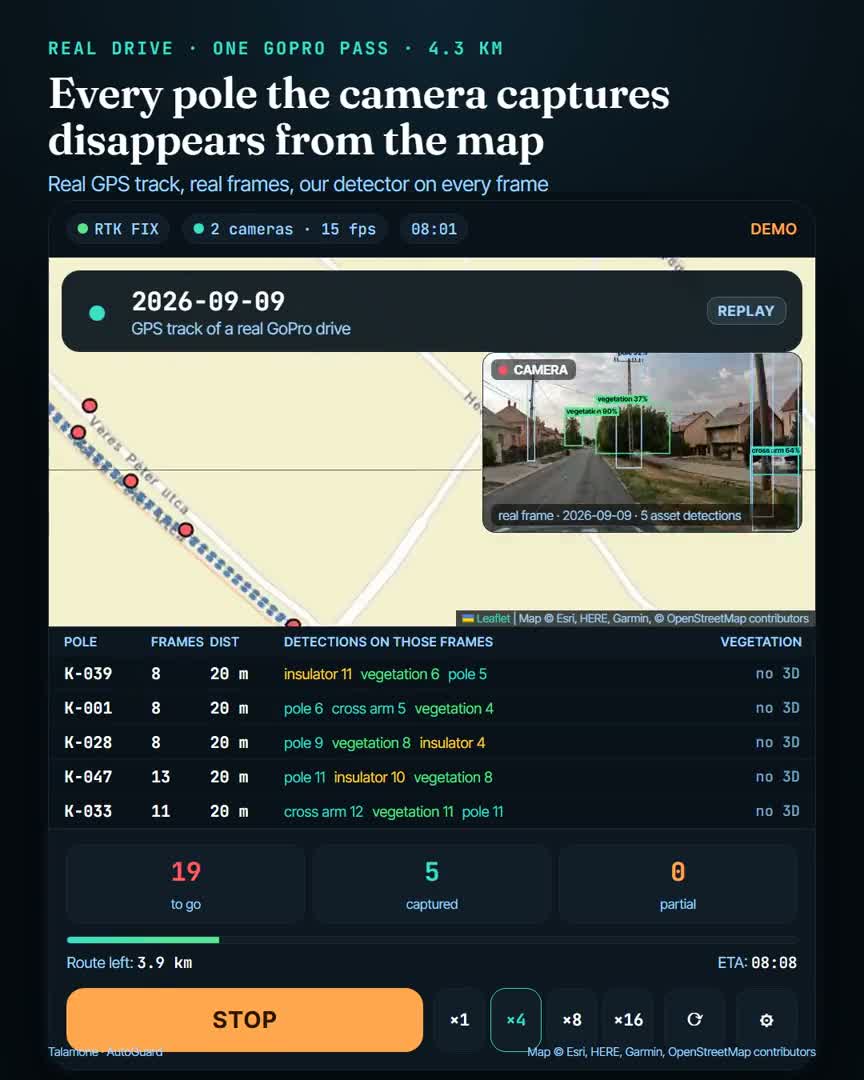
In our experience urban areas often have no consistent pole records at all — and where records exist, they are not much help in the field. In unfamiliar streets, in traffic, with a van parked in front of the pole, no crew can keep track of which pole was actually captured. So the screen does it.
1 · Before the driveEvery pole in the area is on the map, all of them still to do.
2 · Captured poles drop offSeen from close enough, on enough frames — the pole disappears from the map.
3 · Blocked stays on the mapA van in the way, a branch, a bus: the capture is unusable, so the pole stays — it does not quietly count as done.
No stock footage and no mock-ups: every number on the city pages comes from a camera that actually drove that street, and every claim that is only an estimate is marked as one. Where we have not measured something — a vegetation height without a 3D reconstruction, for example — the page says so instead of showing a number. The defect list we detect today is the one you can see on those pages; we extend it to whatever list your own inspections use.