Right-of-way encroachment detection · for power networks

Buildings in the right-of-way, found span by span.

Every structure near your lines, tied to the span and pole it sits by, with its distance from the outer conductor and the date it was first seen. Not a building map. A work list.

Buildings in a power line easement coloured by distance to the line, on a 50 cm satellite image
Line axis 20 m core zone 40 m easement Building in the core zone Building in the easement
Archive 50 cm image with building footprints, coloured by distance to the line axis. Satellite image © CNES 2021, distribution Airbus DS · Building footprints: Overture Maps Foundation, incl. Google Open Buildings (CC BY 4.0)
01

What stands in the corridor today

One sub-metre survey of the whole right-of-way. Each candidate structure comes with its span, distance from the conductor, footprint and an image crop, ready for a field check in FieldGuard.
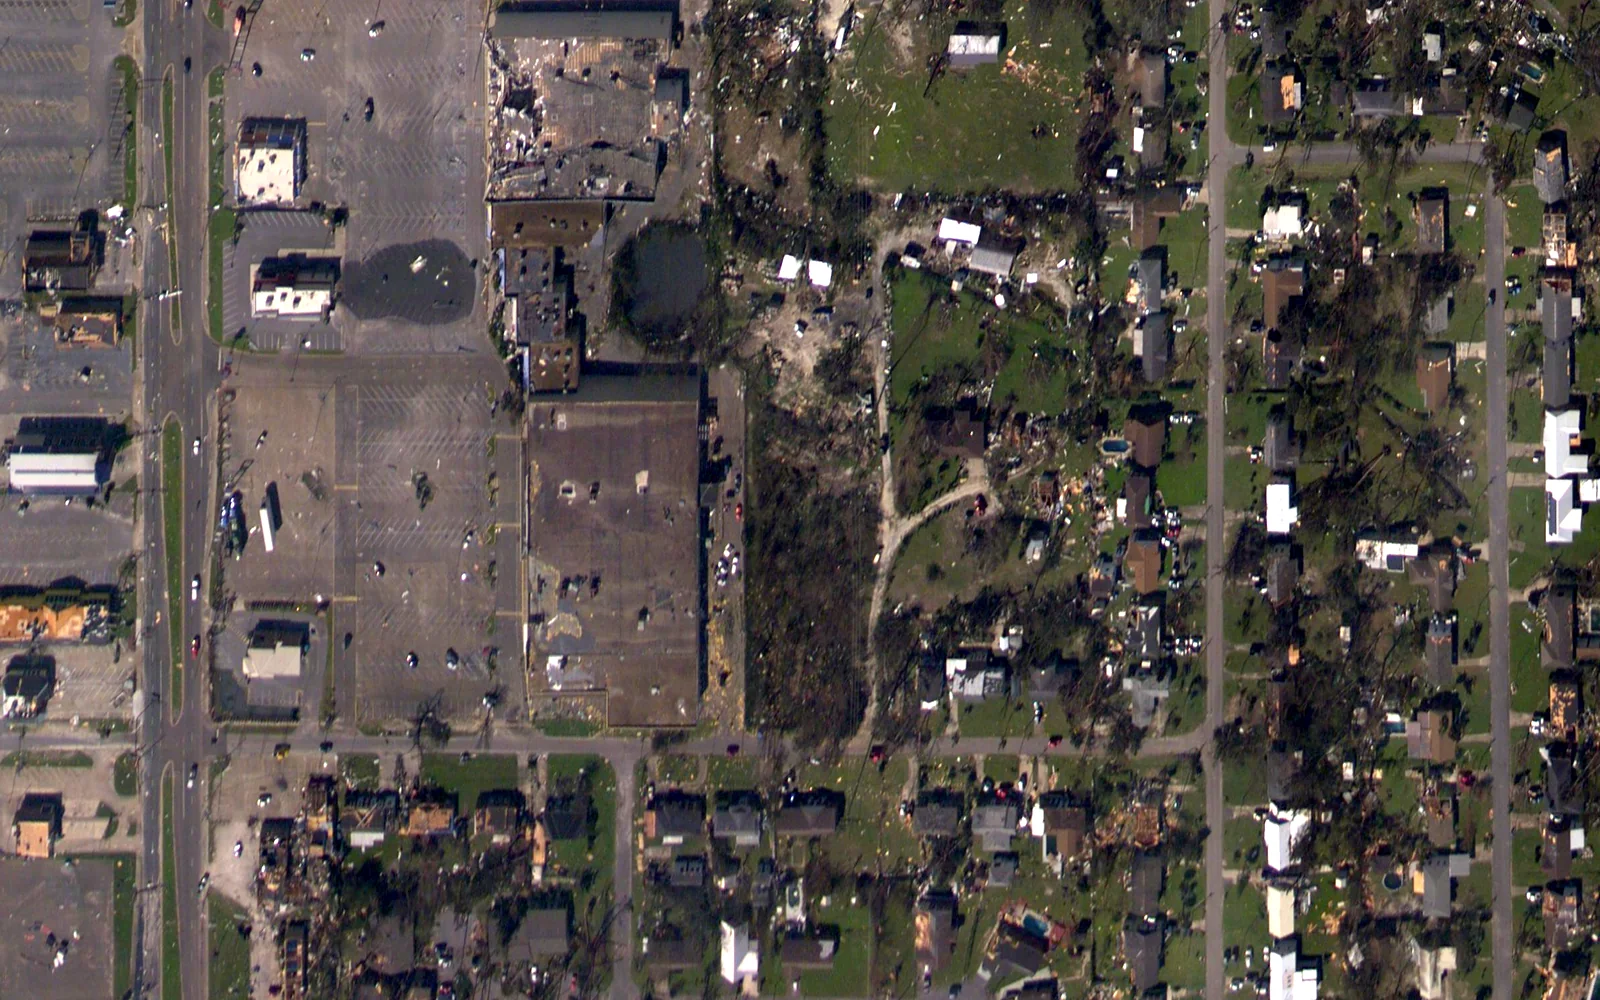
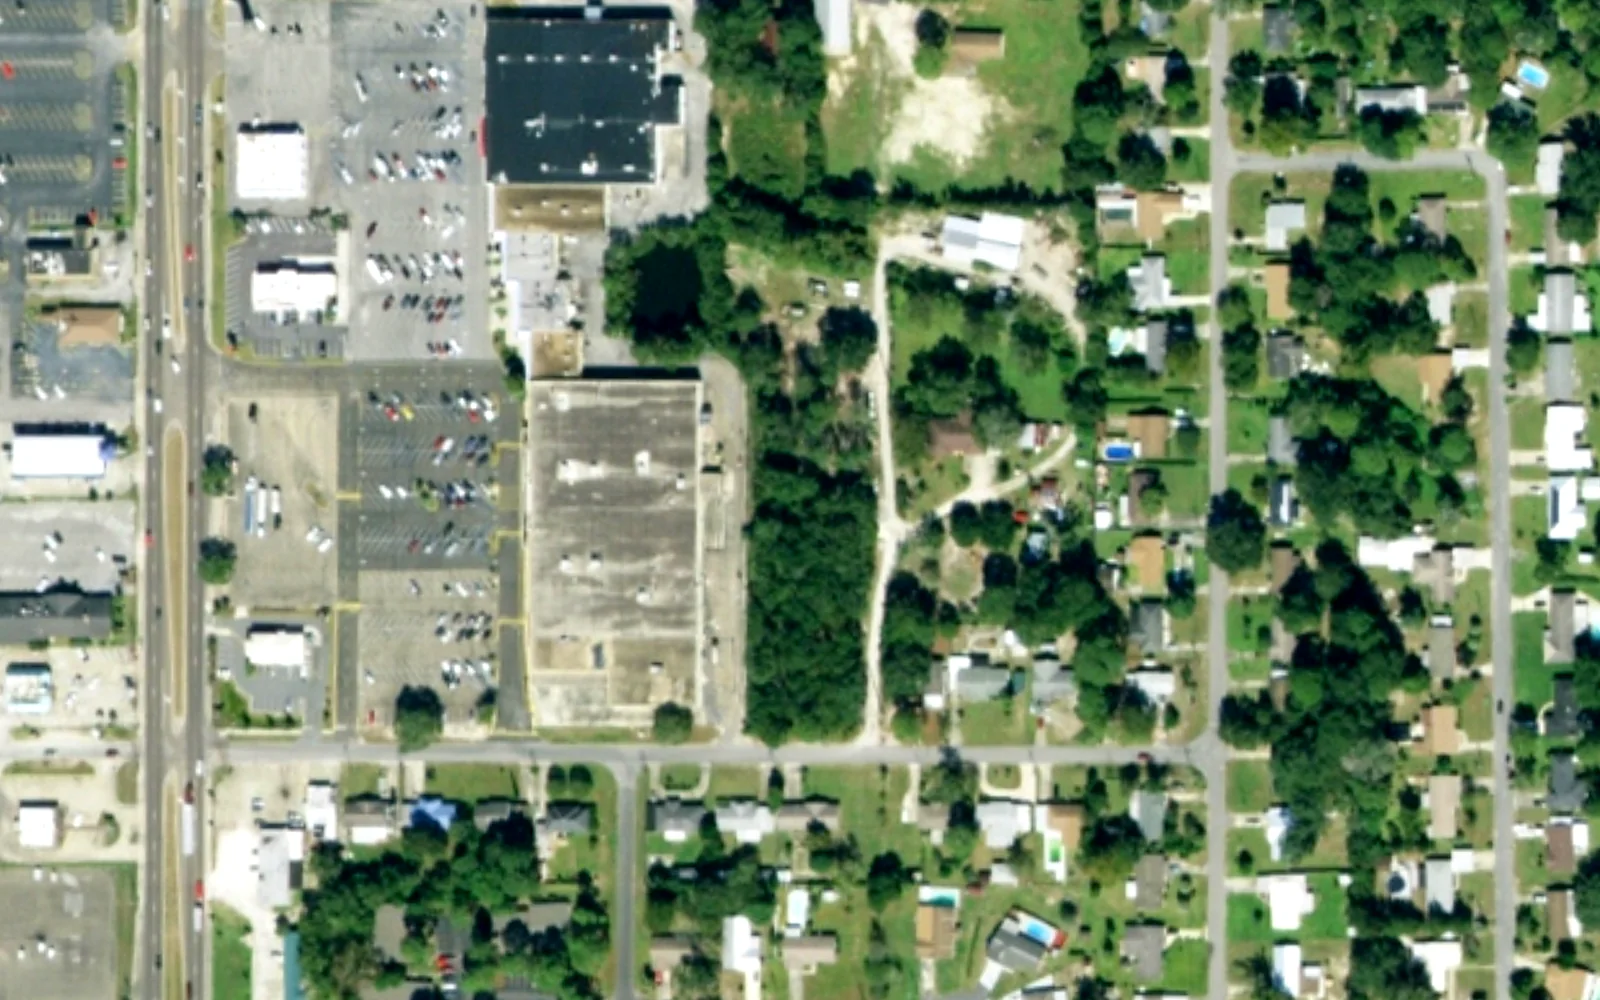
Aerial image of the same residential blocks and a shopping centre in October 2018 The same residential blocks and shopping centre in October 2017
The same blocks in Callaway, Florida, a year apart. Drag the divider, or focus it and use the arrow keys. 2017: USDA NAIP (public domain) · 2018: NOAA NGS Emergency Response Imagery (public domain)
02

What is new

The corridor is screened continuously. When ground is cleared or earthworks start, you get a point to check, not a pile of imagery, and you can order a sharp image of just that spot in the marketplace.

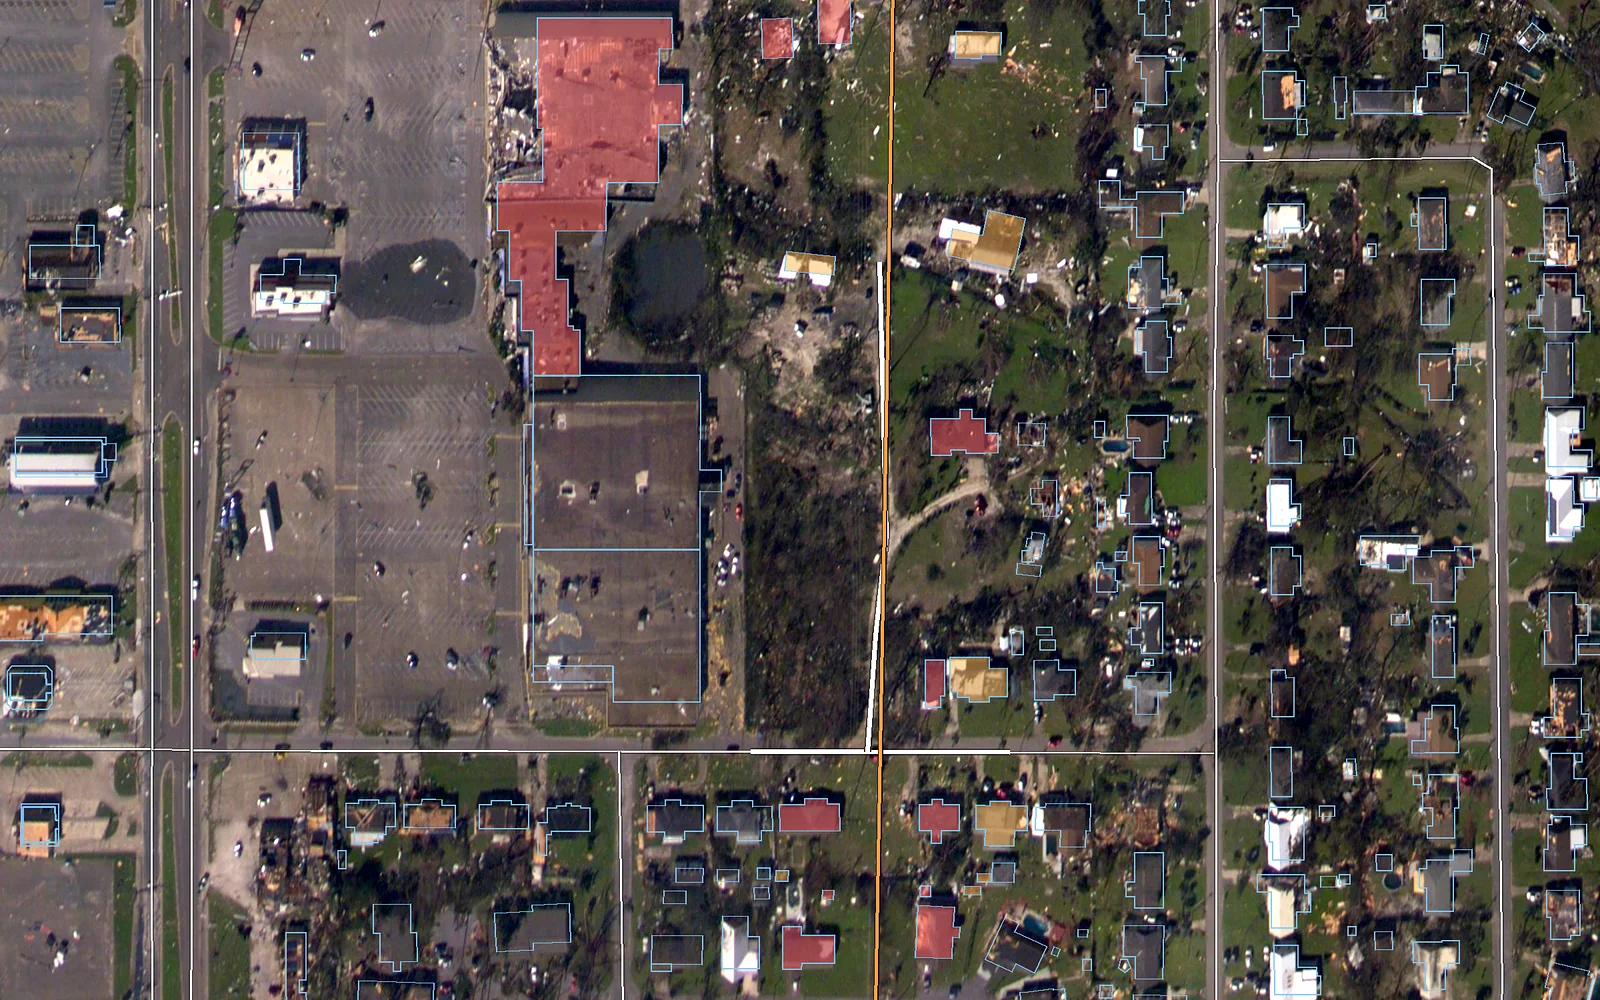
Building footprints near a power line coloured by distance to the line, with the roads near the line drawn in white
Power line Building within 20 m of the line Building 20–40 m from the line Road within 50 m of the line
Footprints shown by distance from the line. NOAA NGS Emergency Response Imagery (public domain) · © OpenStreetMap contributors (ODbL) · Buildings: Overture Maps Foundation (ODbL)
03

What was hit

After a storm, flood or fire: which buildings, roads and access tracks in the affected area are damaged or blocked, on the same span record as the network findings.

3D

Every building along the line, in 3D

A real neighbourhood after a hurricane. Building footprints with heights measured by airborne LiDAR, a power line, the trees around it, and aerial imagery from before and after the storm. Point at a building to see its distance from the line and its height.

Encroachment

What counts as encroachment on a power line right-of-way?

Houses, extensions, sheds, garages, greenhouses, containers, storage yards and fresh earthworks inside the easement or safety zone of an overhead line. They reduce clearance, block access for crews and machines, and raise fire and liability risk. Zone widths depend on the country and the voltage level, so we apply your own rules per line, not one fixed buffer.

Per structure

What you get for every structure

  • Span and pole identifiers from your own network data
  • Distance from the outer conductor, not just from the line axis
  • Footprint area and zone (core, edge, buffer, as your rules define them)
  • The image date it was first seen, and an image crop as proof
  • Status: open, checked in the field, resolved

Delivered as CSV, GeoJSON, shapefile or Esri layer, as work packages in FieldGuard, or through the API into SAP PM and your GIS.

Existing and new

Existing encroachment and new construction are two different jobs

Existing structures

One sharp survey of the whole corridor gives the baseline. Every candidate is checked on the image before it reaches you.

New construction

The corridor is screened continuously for cleared ground and earthworks, the first visible step of building. A flagged spot is a point to check. If you want a sharp image of it, you choose one in the marketplace.

One record

Buildings, trees and storms on one span record

Buildings sit on the same span record as vegetation and storm findings. A span with a shed in the easement and a hazard tree next to it shows up once, with both findings.

From image to crew

How a finding reaches the crew

  1. Detection
  2. Span and distance
  3. Image proof
  4. Work package
  5. Field confirmation
  6. Next survey checks it again
Small structures

Why small structures need sharp imagery

Sheds and shelters under a line are typically 20–60 m². Sub-metre imagery resolves them. That is why the screening is wide and cheap, and the confirmation is targeted.

Questions

Building encroachment: frequently asked questions

Can satellites detect buildings in a power line right-of-way?

Yes. On sub-metre imagery even small sheds and shelters are visible. Every candidate is checked on the image before it is listed.

How is the distance to the line measured?

From the conductor geometry in your network data, per span, to the nearest edge of the structure.

How do you spot new construction?

The corridor is screened continuously for cleared ground and earthworks. Flagged spots become points to check, and you can order a sharp image of just that spot.

Do we have to buy imagery for the whole network?

No. Only the corridor strip, and you choose the scene and date in the marketplace.

Which formats and systems are supported?

CSV, GeoJSON, shapefile, Esri layers, FieldGuard work packages, and an API to SAP PM and GIS.

Start with your network

Draw your network section. We show what stands in it.