Satellite vs LiDAR vs drone for vegetation management: which one, when
Use the satellite to screen every span continuously, then send LiDAR, high-resolution imagery or a drone only to the spans the screening flags. Base-resolution satellite shows where vegetation is, how it changes and how dry it is, but not the exact clearance to the conductor; LiDAR measures clearance, but only on the day it was flown. Drone and vehicle photos answer pole and component questions, and the field crew confirms and closes the work.

What are the options for remote sensing along a power line?
There are four carriers: satellite, aircraft or drone, vehicle and the field crew. Each carries different sensors, and each answers a different question well. The useful question is not which one is better, but which question each one should answer on your network.
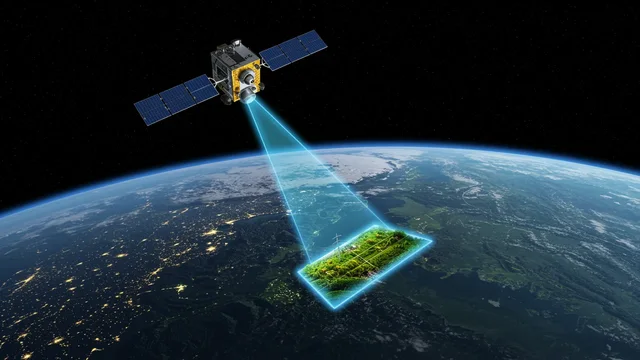
Every span, again and again
Base resolution (Sentinel-2) for continuous whole-network screening; 0.3–0.5 m and stereo imagery bought for flagged sections.
Satellite →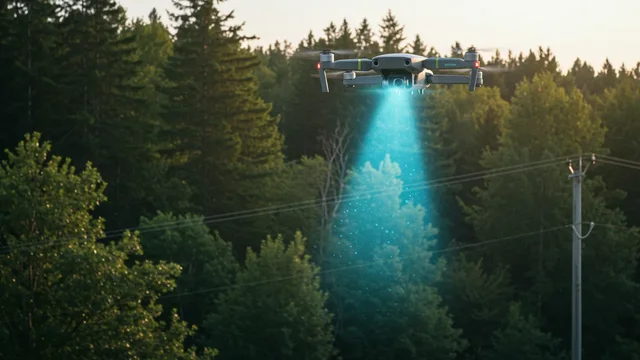
LiDAR and close-up photos
LiDAR for clearance and fall-in; drone photos with AI for poles, insulators and defects.
Drone platform →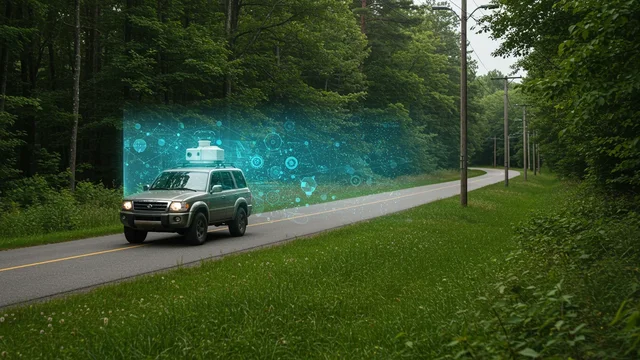
Street level, at driving speed
Photos with AI: pole inventory, assets on each pole, roadside vegetation.
AutoGuard →
Confirm, cut, prove
Offline app for crews: work packages tied to the span, photos, completion evidence.
FieldGuard →Which method answers which question?
Rows are the questions a vegetation or asset manager has to answer. Columns are the methods. “Best” means the method is the natural first choice for that question; “possible” means it can contribute with limits; “no” means it cannot answer it in a way you should act on.
| Question to answer | Satellite, base resolution (10 m) | Satellite, high-res 0.3–0.5 m | Airborne or drone LiDAR | Drone photo + AI | Vehicle photo + AI | Field crew app |
|---|---|---|---|---|---|---|
| Whole-network screening | Best Every span with each usable pass, at a cost per length that works for the whole network. |
Possible Bought per area; sensible for flagged sections, costly for the whole network. |
Possible Full-network flights are costly and give one snapshot in time. |
No Flown span by span; not practical as a network-wide screen. |
Possible Covers lines along drivable roads, not cross-country sections. |
Possible Foot or vehicle patrol: slow, and depends on the person. |
| Height and clearance to the conductor | No Height in bands only; a 10 m pixel cannot give exact clearance and does not see the wire. |
Possible Stereo gives single-tree height; conductor sag is not measured. |
Best Wire and vegetation in the same point cloud. Valid for the flight date and line load on that day. |
Possible Photogrammetry gives the canopy surface; thin wires are hard to reconstruct from photos. |
Possible Height where the street geometry allows it; roadside only. |
Possible Spot measurement on site, e.g. with a rangefinder; confirms a single span. |
| Fall-in reach (trees outside the corridor) | Possible Flags tall height bands in the environmental zone; not individual trees. |
Possible Single crowns and, with stereo, tree heights for the flagged section. |
Best Height and distance of each tree to the line: a geometric fall-in test. |
Possible Local, for the spans flown. |
Possible Trees visible from the road side only. |
Possible Arborist confirms lean, decay and defects that no sensor sees fully. |
| Species, dryness, condition | Best Multispectral bands show dryness and condition against each span's own history; evergreen/deciduous share. Needs cloud-free days. |
Possible Crown-level detail, but few spectral bands and usually one date. |
Possible Structure, not condition: no dryness signal from the point cloud alone. |
Possible Visible crown condition on the spans flown; species with care. |
Possible Roadside trees only. |
Best Species and tree health confirmed on site. |
| Pole and insulator defects | No Components are far below the pixel size. |
No 0.3–0.5 m cannot resolve insulators or fittings; large changes at towers only. |
Possible Pole lean and geometry; not cracks, corrosion or broken parts. |
Best Close-up, all-round photos; AI flags defects, an expert confirms. Thermal capable. |
Possible Seen from below and from the road; good for visible damage and missing parts. |
Possible Crews record findings with photos while on site. |
| Roadside vegetation and pole inventory | Possible Vegetation along roads, yes; poles, no. |
Possible Poles sometimes visible from above; no attributes. |
Possible Poles and wires classified in the point cloud, if flown. |
Possible Works, but slow along long roads. |
Best Both sides of the street at driving speed; GPS-tagged pole inventory and assets per pole. |
Possible Manual inventory: accurate, slow. |
| Post-work verification | Best The next clear pass shows canopy change on every span worked. Small trims below one pixel may not show. |
Possible Single trees, for sections where proof matters. |
Possible Exact, but a repeat flight is costly. |
Possible Spot checks of selected spans. |
Possible Roadside spans only. |
Best Photos, GPS and time of the completed work, tied to the span. |
| Storm damage | Possible Change flags after the first clear pass; storms often bring clouds, so this can take days. |
Best Wide-area picture of fallen trees and blocked access, when a clear acquisition exists. |
Possible Exact, but slow to mobilise for an emergency. |
Best Fast and local, under the cloud base. |
Possible Where roads are passable. |
Best Damage confirmed, repair recorded. |
The table is our method assessment, not a measurement. Optical satellites, high-resolution included, need cloud-free days. On a phone, the table scrolls sideways.
How do you combine them so expensive data is used only where needed?
Risk-based vegetation management turns the table into a sequence. The low-cost, continuous layer looks at everything; the precise and costly layers look only where the first one points.
- Satellite screens every spanBase-resolution satellite, with each usable pass: vegetation, height bands, change, dryness.
- Risk class per spanEach span and pole gets a risk class, HC0 to HC3, inside your buffer and environmental zones.
- Precise data only where flaggedHigh-resolution, LiDAR or drone for the flagged spans; vehicle survey where roads follow the line.
- Work packageThe flagged and confirmed spans become a ranked work package.
- FieldGuard crewOffline app, tied to the span: the crew works, photographs and closes the job.
- Next pass verifiesThe next clear satellite pass checks the span, and the risk class updates.
↻ The loop starts again at step 01: a continuous, measured picture instead of a one-off survey.
What can Sentinel-2 see along a power line, and what can't it?
Sentinel-2 records 13 spectral bands, four of them at 10 m, and revisits the same place every 5 days at the Equator, more often at higher latitudes.[3] That is enough to see where vegetation stands along each span, how it changes between passes, and how dry or stressed it is compared with its own history.
- It can: screen the whole network continuously, give vegetation height in bands, flag change (growth, clearing, storm damage, drying), show waterlogging and the evergreen/deciduous share.
- It cannot: see the conductor, give exact clearance in metres, see individual small trees or pole components, or see through clouds. Cloudy passes are discarded, so the refresh depends on the weather.
When do you need LiDAR?
When a decision depends on metres: clearance between vegetation and the conductor, the fall-in distance of a specific tree, or a compliance record that has to state a measured distance. LiDAR puts the wire and the trees in the same point cloud, so clearance is a direct measurement.
Its limit is time. A LiDAR survey is a snapshot: vegetation grows after the flight, and conductor sag depends on temperature and load on the day it was flown. That is why LiDAR is most valuable on the spans the satellite flags, and why the continuous layer keeps watching after the flight.
For survey and design of new and rebuilt transmission lines above 110 kV, IEEE 1936.3-2025 sets out technical requirements for drone (UAS) LiDAR surveys, from flight design to data processing; the standard is also meant as a reference for operation and maintenance.[2] Upload a point cloud yourself in the self-service LiDAR analysis, or see LidarGuard.
When is drone photo + AI better than LiDAR?
When the question is about the asset, not the distance. Cracked insulators, damaged cross arms, missing parts, corrosion, bird nests and hot spots (with a thermal camera) are visible in close-up photos and invisible in a point cloud. A drone flight with a planned shot list gives all-round photos of each pole; the AI marks candidates and an expert confirms them.
Drone photos are also the faster tool after a storm on a short section. For clearance in metres along many kilometres, LiDAR remains the right tool. See the drone platform or try the image analysis demo on your own pole photos.
What does a vehicle survey add?
Much of the distribution network runs along roads. A vehicle with cameras on both sides captures those poles at driving speed: where each pole is, what is on it, what is missing, and the vegetation along the street. It is a vehicle-mounted pole inspection and an inventory in one pass, which no satellite and no corridor flight gives you at street level.
Its limit is reach: lines that leave the road are out of view. See AutoGuard.
Which approach links detection to crew work orders and proof of completion?
No sensor does this alone. The link is the span: if every finding, from any carrier, is stored against the same span and pole identifier, then a satellite flag, a LiDAR clearance and a drone defect end up in one work package. The crew opens that package in the field app, works offline, and returns photos and the time and place of the work. The next satellite pass then checks the span again.
With GridGuardian you find all of it in one place: detection, risk class, work package, FieldGuard crew app and completion evidence. Exports go to SAP PM, Power BI, files or the API. More on this in post-work verification.
How accurate is tree height from satellite compared with LiDAR?
Not accurate enough for clearance in metres, and it should not be sold as such. It is accurate enough to sort the network into height bands and to tell you where LiDAR is worth flying.
Sentinel-2 height is metres off, not centimetres
A 2026 study in the ISPRS Annals estimated vegetation height near transmission lines from Sentinel-2 and GEDI data with convolutional neural networks. Against high-resolution LiDAR it reported a root mean square error of 7.7 m and a mean absolute error of 5 m.[1]
An error of that size is fine for “is there tall vegetation here?” and not fine for “is this tree 3 m or 6 m from the conductor?”.
Height in bands, calibrated with LiDAR
- Our own neural network classifies vegetation along every span into height bands from Sentinel-2, not into exact metres.
- The bands are calibrated against LiDAR, and each new LiDAR survey can calibrate the model to your terrain.
- Exact height and clearance come from LiDAR or stereo high-resolution imagery, on the spans that need it.
- The machine pre-labels; an expert validates.
Rule of thumb: use satellite height to decide where to look, and LiDAR or stereo to decide what to cut. More terms in the vegetation management glossary.
What does each method cost, and where should you pay for LiDAR?
Pay for LiDAR on the flagged share of the network, not on the whole network. The continuous satellite layer is priced per length of line; the precise layers are priced per corridor length or per pole, and you choose how much of the network gets them. List prices, as published on the pricing page:
| Method | List price | Priced on |
|---|---|---|
| Satellite, base resolution | $9 /mile/yr · €5 /km/yr (Base, quarterly) $14.50 /mile/yr · €8 /km/yr (Extended, monthly) $22 /mile/yr · €12 /km/yr (Complete, weekly) | Length of network watched |
| Satellite, high-res 0.3–0.5 m | At market price, only for the sections you choose | Area bought; prices visible in the data marketplace |
| LiDAR processing | $90 /mile · €50 /km | Length of corridor uploaded; survey flights on request |
| Drone photo + AI | $1.1 /pole/yr · €1 /pole/yr | Per pole, above a minimum number of contracted poles |
| Vehicle photo + AI | $1.1 /pole/yr · €1 /pole/yr | Per pole, above a minimum number of contracted poles |
| Field crew app | Included in the Complete package | With task management |
Image analysis prices cover AI analysis and processing; collection with your own drones or vehicles, or through a partner network. The first 100 km of satellite are free. For a full cost comparison, see vegetation management cost.
Where to go next
Satellite, LiDAR, drone or vehicle: frequent questions
Is satellite or LiDAR better for vegetation management?
They answer different questions. Satellite screens the whole network continuously and shows where vegetation is, how it changes and how dry it is. LiDAR measures exact clearance and tree height, but only for the day it was flown. Risk-based vegetation management uses the satellite everywhere and LiDAR where the satellite flags risk.
Can Sentinel-2 measure clearance to the conductor?
No. At 10 m pixel size it does not see the wire and cannot give clearance in metres. It can give vegetation height in bands, calibrated with LiDAR, which is enough to rank spans and decide where to fly LiDAR or buy stereo imagery.
When is a drone better than LiDAR?
When the question is about the asset: insulators, cross arms, missing parts, corrosion, nests or hot spots. These show in close-up photos, not in a point cloud. For clearance in metres along many kilometres, LiDAR is the right tool.
What does a vehicle survey add to satellite and drone data?
Street-level coverage at driving speed: a GPS-tagged pole inventory, the assets on each pole and the roadside vegetation, both sides in one pass. Lines that leave the road are out of its reach.
Does optical satellite work under clouds?
No. Optical satellites, base and high resolution alike, need cloud-free days. Cloudy passes are discarded, so after a storm the first usable satellite picture can take days; drones and field crews cover that gap.
How do I avoid paying for LiDAR on the whole network?
Let the satellite screen every span first. Each span gets a risk class, and LiDAR, high-resolution imagery or a drone flight goes only to the flagged spans. You pay for precise data on the flagged share, not on every kilometre.
How do findings become crew work orders?
Every finding, from any carrier, is stored against the same span and pole. Flagged spans form a work package that goes to the FieldGuard app; the crew works offline, returns photos as completion evidence, and the next satellite pass checks the span.
Sources
- Majin Erazo, J. et al. (2026). HVAS: Detection of Vegetation Height near Electric Transmission Lines Using Deep Learning and Satellite Images. ISPRS Annals of the Photogrammetry, Remote Sensing and Spatial Information Sciences, X-3/W4-2025, 227. doi:10.5194/isprs-annals-X-3-W4-2025-227-2026. isprs-annals.copernicus.org/articles/X-3-W4-2025/227/2026/
- IEEE Standards Association. IEEE 1936.3-2025: technical requirements for UAS LiDAR survey of overhead transmission lines above 110 kV. standards.ieee.org/ieee/1936.3/11009/
- European Space Agency, SentiWiki. Sentinel-2 mission overview (13 bands, four at 10 m; 5-day revisit at the Equator). sentiwiki.copernicus.eu/web/s2-mission
- Talamone GridGuardian list prices: /pricing.html
Start with the screening layer: 100 km, free
Send us a corridor and its geometry. We set up the satellite base system on it, and you see which spans would need LiDAR, drone or vehicle data.