Dynamic satellite vegetation management
Cut where the risk is, when it is. Every span is re-measured with each usable satellite pass. You set the buffer and environmental zones, and LiDAR or high-resolution imagery comes in only where the risk calls for it.
Three things a fixed survey can't do
A one-off survey is a photograph. The day after it is flown, the vegetation starts to move away from it. Dynamic management keeps the picture current, lets you ask new questions of it, and brings in the precise tools only where they pay off.
Continuous data, automated change monitoring
The satellite keeps coming back, and every clear pass updates every span. The risk picture follows the vegetation continuously, instead of ageing for years after a one-off survey.
Automated change monitoring compares each new pass with the span's own history and flags what moved: new growth, clearing, storm damage, drying. Nobody has to look at every span to find the few that changed.
Buffer and environmental zone, on demand
The analysis covers a wide strip along the line. You set how wide the buffer and the environmental zone are, per voltage level or per section, and every figure is recalculated at once. No new survey.
LiDAR and high resolution, only where needed
This is the core. The satellite screens the whole network continuously; LiDAR and 0.3–0.5 m satellite imagery go only to the spans the screening flags. That is what makes risk-based management affordable on every kilometre.
The sensors support the decision. People make it.
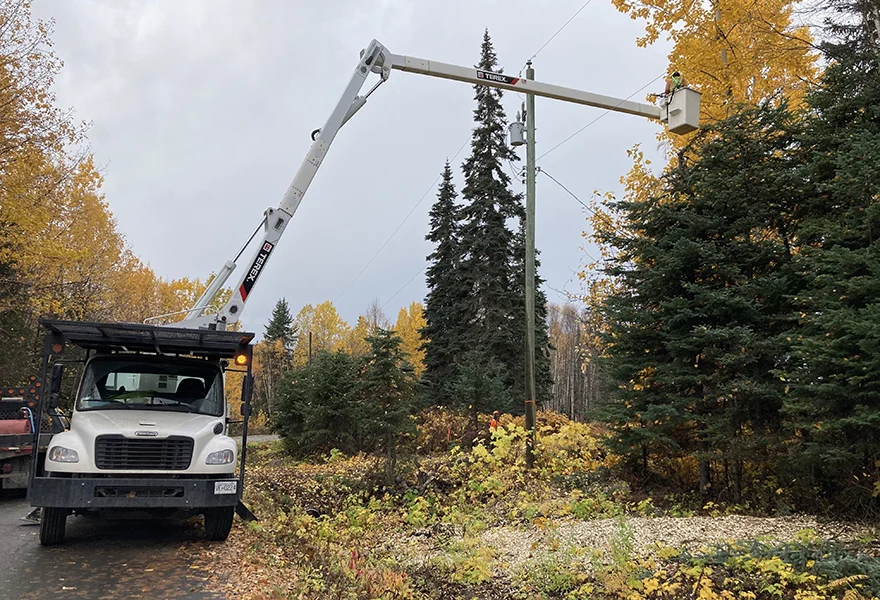
Satellite, LiDAR and imagery rank the risk; the engineer and the crew decide what is cut, when, and how. That is why the field is connected directly: the same span, the same risk class, on the crew's device.
- Work packages go straight to the FieldGuard app, tied to the span
- Works offline in the field, syncs when there is signal
- Photos and findings come back to the same span, and the next satellite pass verifies the result
Move the zones. The answer moves with them.
The buffer zone is the clearance band of the right-of-way where vegetation must not be. The environmental zone is everything around it that can still reach the line or matter to the work: trees that can fall in, dry fuel, protected habitats, wet ground. Try it on this illustrative corridor.
In the real system the zones are set per voltage level or per section, and the counts become kilometres and spans per risk class. Illustration only: the corridor and trees are generated. Drag to rotate.
Screen everything. Measure precisely only where the risk is.
The basis of risk-based management is a cheap, continuous look at every span, and an expensive, exact look only at the few that need it. LiDAR and high-resolution imagery stop being a calendar cost over the whole network and become a targeted answer to a flagged risk.
Pick a class, see where the work is
Each span along the line carries its risk class, from the satellite screening and, where flown, the LiDAR. Filter by class to see where precise data and crews are needed, and where the line can simply be watched.
Illustration: generated spans. Hover or tap a span, or a cell of the matrix below; drag to rotate.
Risk is exposure times hazard
Exposure is how much is at stake on a span: how close the vegetation is to the line, the voltage, what the span feeds. Hazard is how likely the vegetation is to cause trouble: growth rate, species, dryness, storm and fall-in potential. Their product puts every span into one of four classes, and the work list is sorted by it.
A fast-growing strip next to a quiet rural line and a slow oak beside a critical feeder do not get the same treatment, even if they are the same distance from the conductor.
Every span, every 3–5 years
- Crews visit spans that did not need it, while fast growth elsewhere waits its turn.
- The budget follows the calendar, not the risk.
- Between visits there is no information at all.
Every span, every usable pass
- Each span carries a class (HC0–HC3) that updates as new passes arrive.
- LiDAR, high-resolution imagery and crews go only where the class calls for them, in order of risk.
- After the work, the next pass shows whether the span came back to HC0.
From screening to centimetres, only where it pays
The open satellite tells you where and when. When a span needs an exact answer, two more layers open from here.

Exact clearance and fall-in, in 3D
Conductor-to-vegetation distance, trees that can reach the line if they fall, and the canopy height model along every span. A LiDAR stretch also calibrates the satellite model to your terrain and species.
- Upload your own LiDAR survey and get the corridor analysis
- Processing €50/km · $90/mile
- Flown or re-flown where the risk class calls for it
Which trees can reach the line if they fall?
Around every tall tree near the line, the ring is the tree's own height. If the ring reaches a conductor, the tree is a fall-in risk, even if it stands well outside the clearance band. This is where LiDAR height pays for itself.
Illustration: generated trees. Drag to rotate.

What exists for your network, and what it costs per km
Draw your corridor or drop your route file, and see which high-resolution products exist for it, and what each one detects along the line. The price is per kilometre of line, not per km² of image.
- 24 providers, 71 collections, down to 6 cm
- Your route file stays in your browser
- Targeted to the sections the screening flags
Not just trees near wires. The whole living corridor.
The same span-level analysis answers the questions that sit next to clearance: what is drying out, what is protected, what is flooding, what grows back. All of it is tied to your spans and refreshed with the satellite.
Grow-in
Height band, vigour and growth trend in the buffer zone, span by span. Our own neural network reads 10 m satellite imagery and places the vegetation on every span within its risk height band, calibrated with LiDAR.
Fall-in
Hazard trees in the environmental zone that could reach the line in a storm, with the height from LiDAR or stereo.
Regrowth
How fast a cut span greens up again, so the next intervention is planned from measurement, not habit.
Drought and fire fuel
Canopy moisture against its own normal, next to the long-term climate trend and the live fire weather.
Biodiversity and protected areas
Spans crossing Natura 2000 and other protected habitats are flagged, so the work respects them from the start.
Bird nesting season
Cutting and mowing scheduled around the breeding season, so the work plan does not run into restricted periods.
Inland water and flooding
Standing water and waterlogged ground along the line: access problems for crews and a stress signal for the trees.
Species and land cover
Forest, shrub, cropland and evergreen share along the corridor; fast-growing species change the plan.
Seasonal outlooks are given as ranges from measured trends, not as predictions.
What you won't find elsewhere in one place
Utility vegetation management software is a crowded field, and satellite vegetation monitoring is only one slice of it. This is where we deliberately do things differently.
| Question | Common in the market | GridGuardian |
|---|---|---|
| Can I see it before a sales call? | Demo after a form and a meeting | Live Atlas, FireAtlas and the data marketplace are public, no login |
| What does it cost? | Price on request, enterprise contract | Published per-km price: €5, €8, €12/km/year; first 100 km free |
| How wide is the corridor? | One fixed width, set at the start | Buffer and environmental zone adjustable at any time, results recalculated |
| Which sensor? | Usually one, and it is presented as enough | Satellite screening, plus LiDAR, high-resolution, drone and vehicle where they add value |
| What is analysed? | Clearance and tree risk | The whole corridor: also drought, fire fuel, biodiversity, nesting season, inland water |
| How reliable is it? | Accuracy claims without the method | Method and limits stated on the page; every result measured against the span's own history |
| Where does the data go? | Vendor cloud | Processing on our own infrastructure; your route file never leaves your browser in the marketplace |
Dryness is visible from orbit weeks before the first flame
Gironde, July 2026. On the ground that later burned around Saumos, we measured the vegetation against its own eight-year normal for that week, from the satellite record alone.
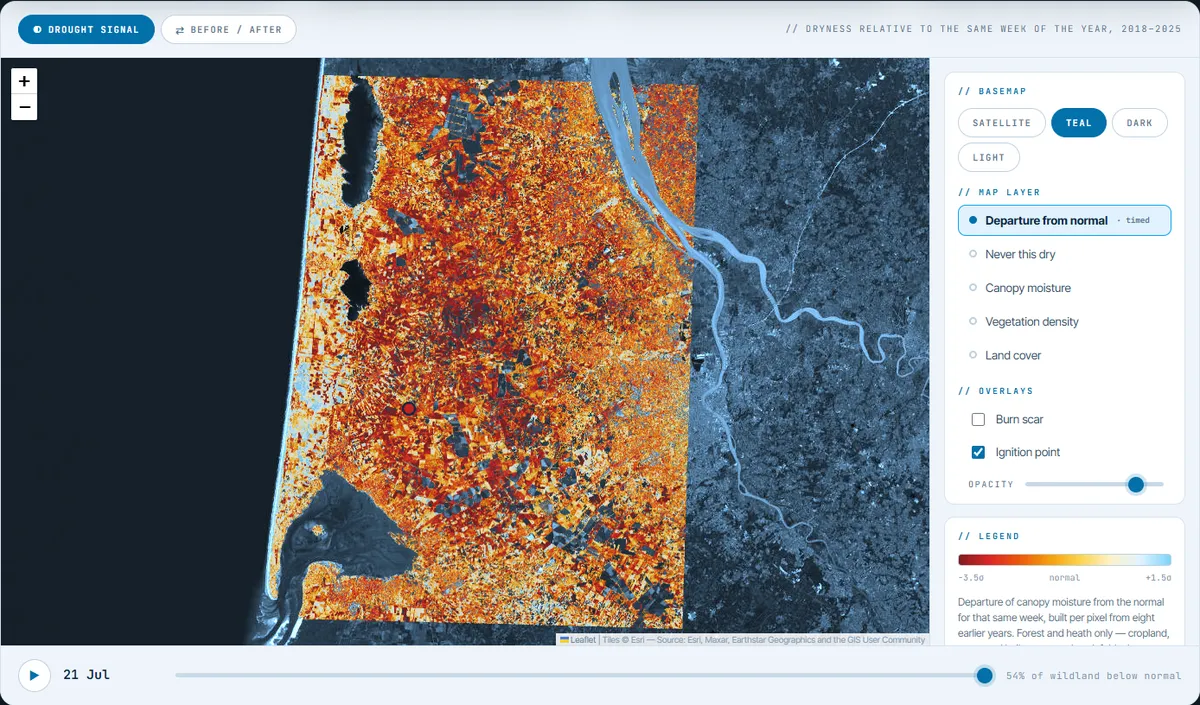
Retrospective, not predictive. We did not forecast this fire, and dry vegetation is a condition, not a cause. The measurement shows that the drying was already visible from orbit, weeks in advance, on the ground that later burned.
The vegetation before the fire
Season, nine-year comparison and burn scar, with the full method.
Open the analysis →Wildfire risk along the grid
Corridor dryness, official fire layers, live fire weather and a 65-year climate trend.
Open FireAtlas →Eight regions, four continents
Span-level vegetation risk on public network data, refreshed with every pass. No login.
Open the Atlas →Each sensor answers a different question
| Method | Answers best | Limits | Typical use |
|---|---|---|---|
| Satellite · base resolution | Where and when: condition, change, dryness and height band on every span (own neural network) | Height in risk bands, not to the metre; cloud | Continuous screening, risk ranking |
| High-res satellite | Single trees, objects, storm damage; height from stereo | Bought per area, minimum order | Sections the screening flags |
| LiDAR | Exact clearance, fall-in distance | Costly per km; ages fast | Calibration and flagged spans |
| Drone | Poles, insulators, single hazard trees | Slow per km; permissions | Confirmation on flagged spans |
| Vehicle camera | Pole inventory, roadside vegetation | Only what the road sees | Distribution lines along roads |
Per kilometre of network, published
You pay for the length of line we watch, not for satellite images. The refresh rate is what changes between packages.
Dynamic buffer zones, span-level risk classes, growth trends, dashboard and API.
Everything in Base, plus monthly reports and risk assessment ahead of the season.
Everything in Extended, plus task management, the field app and full integration.
What grid operators ask first
What is dynamic vegetation management?
It schedules vegetation work by measured risk instead of a fixed calendar. Every span is re-measured with each usable satellite pass and automated change monitoring flags what moved, the buffer and environmental zones can be set to any width without a new survey, and crews go to the spans whose risk class changed.
What is a dynamic buffer zone?
Instead of one fixed corridor width, the analysis covers a wider strip along the line, so the buffer zone (the clearance band) and the environmental zone (the wider surroundings: fall-in trees, fuel, protected habitats, water) can be set per voltage level or per section, and the results are recalculated at once.
Can a satellite measure tree height under a power line?
Yes, in height bands. Talamone's own neural network places the vegetation along every span within its risk height band from 10 m satellite imagery, calibrated against LiDAR, so the height dimension of the risk class covers the whole network. Where a decision needs the exact height or clearance in metres, LiDAR or stereo high-resolution satellite imagery is added for those sections.
How often is the data refreshed?
The satellite data is refreshed continuously; cloud-covered passes are discarded. Change detection runs continuously and on request, to the customer’s needs.
What do you need from us for the 100 km free demo?
A corridor of about 100 km and its network geometry, with span or pole identifiers. We set up the base system on it, and you can check the results in the field with the FieldGuard app.
Where is the data processed?
On our own infrastructure. Your network geometry is used to cut the corridor and to report per span; it is not passed on to satellite providers.
100 km, free, no commitment
Send us a corridor and its geometry. We set up the base system on it, and you check the results in the field.